
You may not be aware that Bollinger Bands are not just another trading indicator; they offer a unique perspective on market volatility and price action.
By understanding how these bands are constructed and how they interact with price movements, you can gain valuable insights into potential trading opportunities.
As you explore the intricacies of Bollinger Bands, you'll discover the nuances that can help you make more informed trading decisions and enhance your overall technical analysis skills.
What Are Bollinger Bands?
What exactly do Bollinger Bands represent in the realm of technical analysis?
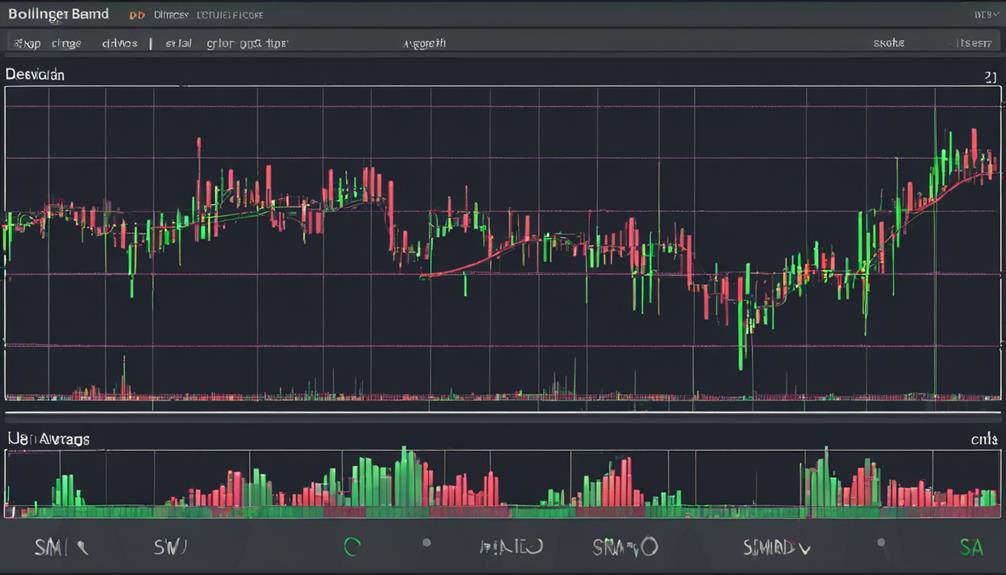
Bollinger Bands, created by John Bollinger, are a widely used tool in trading to analyze price action and volatility levels. They consist of a middle band, typically a 20-period moving average, with upper and lower bands set at 2 standard deviations above and below the average. These bands dynamically adjust to price movements, expanding during periods of high volatility and contracting during calmer market phases.
Traders utilize Bollinger Bands to identify potential buy or sell signals based on how the price interacts with the bands. By customizing the moving average periods and standard deviations, traders gain flexibility in adapting the bands to suit different trading strategies and timeframes.
Understanding the Normal Distribution
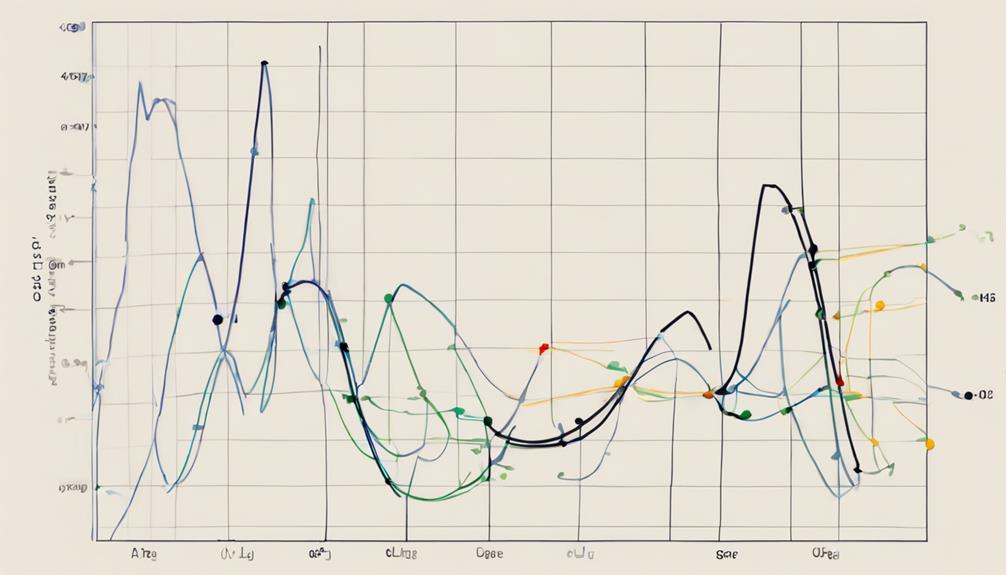
Understanding the normal distribution is foundational for comprehending the statistical principles underpinning Bollinger Bands and their application in technical analysis. The normal distribution, essential in modeling various phenomena like stock market price movements, has a bell-shaped curve.
Standard deviation, measuring data dispersion around the mean, plays a crucial role in determining the upper and lower bands of Bollinger Bands. These bands, based on a moving average and standard deviations, help identify potential trend reversals, overbought or oversold conditions, and market volatility.
Interpreting Standard Deviations
Interpreting standard deviations within Bollinger Bands provides key insights into price volatility dynamics around the moving average, crucial for making informed trading decisions. Here's what you need to know:
- Standard deviations in Bollinger Bands help gauge price volatility, showing how far prices typically deviate from the moving average.
- Changes in volatility cause the bands to either expand or contract, impacting trading signals and potential outcomes.
- Extreme market conditions can be identified when prices move beyond the standard range, signaling potential shifts in price action. Understanding these deviations is vital for interpreting market movements accurately.
Bollinger Bands Formula Explained
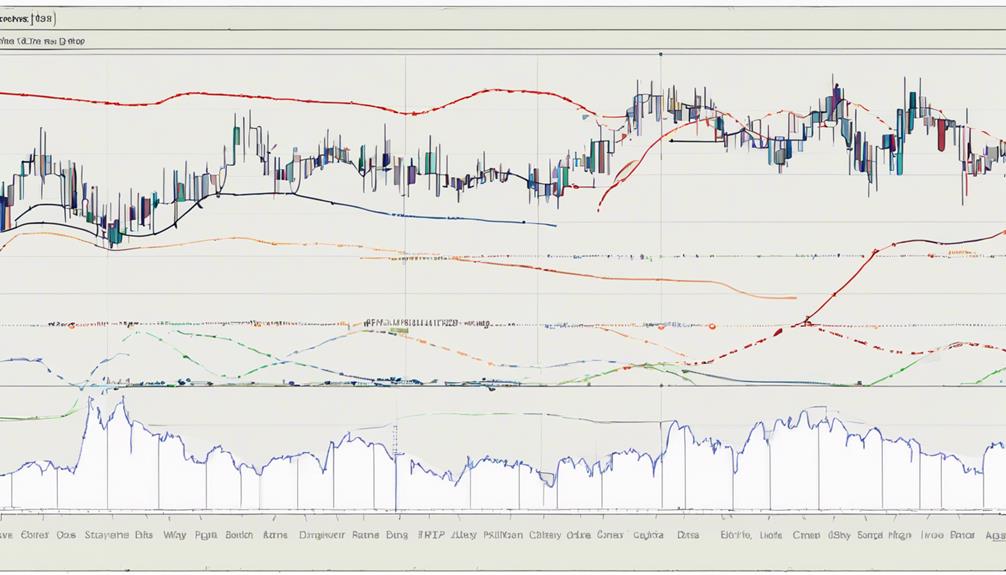
Analyzing the Bollinger Bands formula sheds light on how upper, middle, and lower bands are derived to provide traders with valuable insights into price volatility dynamics and potential market reversals.
The formula involves calculating the middle band as a moving average over N periods. The upper and lower bands are typically set at 2 standard deviations from this mean.
Price movements nearing the upper band indicate potential overbought conditions, while movements close to the lower band suggest oversold conditions. By utilizing these bands, traders can assess market volatility, determine the strength of a trend, and identify possible points of reversal.
Understanding the Bollinger Bands formula equips traders with a powerful tool to interpret price movements and make informed trading decisions.
How Can I Use Bollinger Bands to Improve My Trading Strategy as a Beginner?
Understanding Bollinger Bands essential for novice traders wanting to improve their trading strategy. These bands help identify potential buy or sell signals and understand market volatility. By learning to interpret Bollinger Bands accurately, beginners can make more informed decisions and increase their chances of trading success.
What Are the Key Benefits of Understanding Bollinger Bands for Beginners?
Understanding Bollinger Bands essential for beginners as it helps in identifying market trends and potential price reversals. It provides valuable insights into volatility and can be used to make informed trading decisions. Additionally, it assists in setting realistic profit targets and stop-loss levels, leading to more successful trading strategies.
Practical Application in Trading
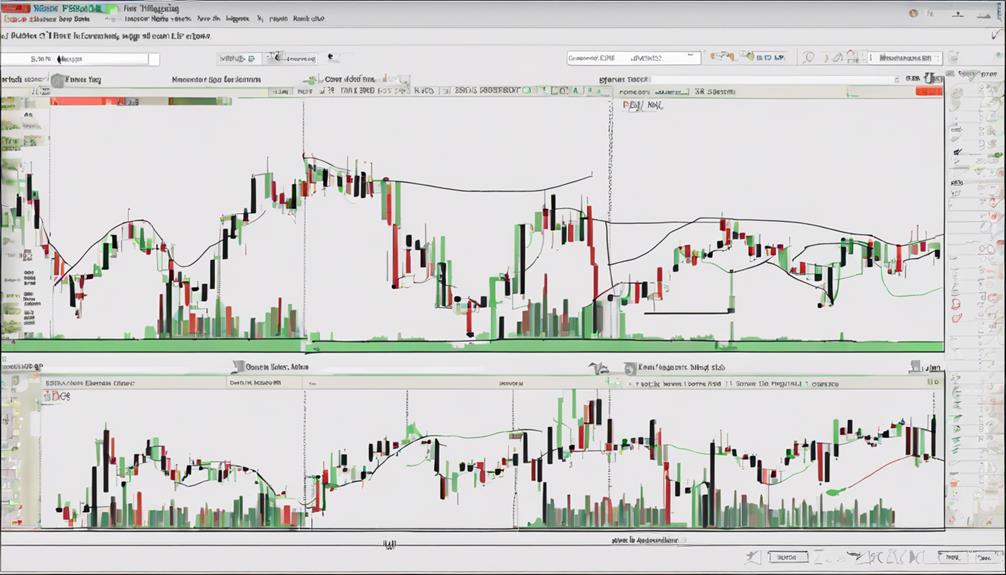
When applying Bollinger Bands in trading, you can leverage the bands to identify potential buy and sell signals based on price volatility. Here's how you can practically apply this technical indicator:
- Use Bollinger Bands in conjunction with other technical indicators to enhance trade accuracy.
- Watch for overbought conditions when prices touch the upper band and oversold conditions when prices touch the lower band.
- Understand how Bollinger Bands expanding and contracting can help gauge market volatility and predict potential trend changes. By interpreting price movements within the bands, you can make informed trading decisions effectively.
Frequently Asked Questions
What Are Bollinger Bands for Dummies?
Bollinger Bands are a technical tool that help you assess price volatility and market conditions. By analyzing these bands, you can identify potential trade opportunities based on overbought or oversold signals. Understanding them is essential for trading success.
How Do You Read and Understand Bollinger Bands?
To read and understand Bollinger Bands, analyze price movements relative to the bands. The upper band signals overbought conditions, the lower band indicates oversold conditions. Consider the band width for volatility insights and use with other indicators for comprehensive analysis.
How Do You Use Bollinger Bands Effectively?
You've got this! To use Bollinger Bands effectively, focus on price movements relative to the bands. Look for squeezes, breakouts, and reversals. Combine with other indicators for confirmation. Stay disciplined and adapt to changing market conditions.
What Is a Bollinger Band in Simple Terms?
In simple terms, a Bollinger Band is a tool that consists of a centerline (moving average) and upper/lower bands based on price deviations. It helps assess price action and volatility, aiding in identifying potential trend reversals.
Conclusion
You've learned how Bollinger Bands can enhance your trading strategy by providing valuable insights into price action and volatility.
While some may argue that Bollinger Bands are too complex, remember that with practice and customization, you can tailor this technical analysis tool to suit your needs.
Embrace the versatility of Bollinger Bands and use them to your advantage in navigating the dynamic world of trading.
Start applying what you've learned and watch your trading skills grow.