
The Parabolic SAR indicator is a powerful tool in a trader's arsenal, offering valuable insights into market trends and potential entry and exit points. Deciphering its signals can be a game-changer for those looking to fine-tune their trading strategies.
By understanding the nuances of this indicator, traders can gain a competitive edge in navigating the complexities of the financial markets.
Exploring the intricacies of the Parabolic SAR guide can unveil a world of possibilities for traders seeking to elevate their trading acumen.
Understanding Parabolic SAR Basics
In the realm of technical analysis, grasping the foundational principles of the Parabolic SAR indicator is essential for traders seeking to navigate potential trend reversals effectively. Developed by J. Welles Wilder Jr., the Parabolic SAR, which stands for Parabolic Stop and Reverse, is a popular technical indicator used to identify potential trend reversals in the market. The indicator works by plotting dots above or below the price chart, with the calculations based on an Acceleration Factor (AF) and Extreme Price (EP) formula.
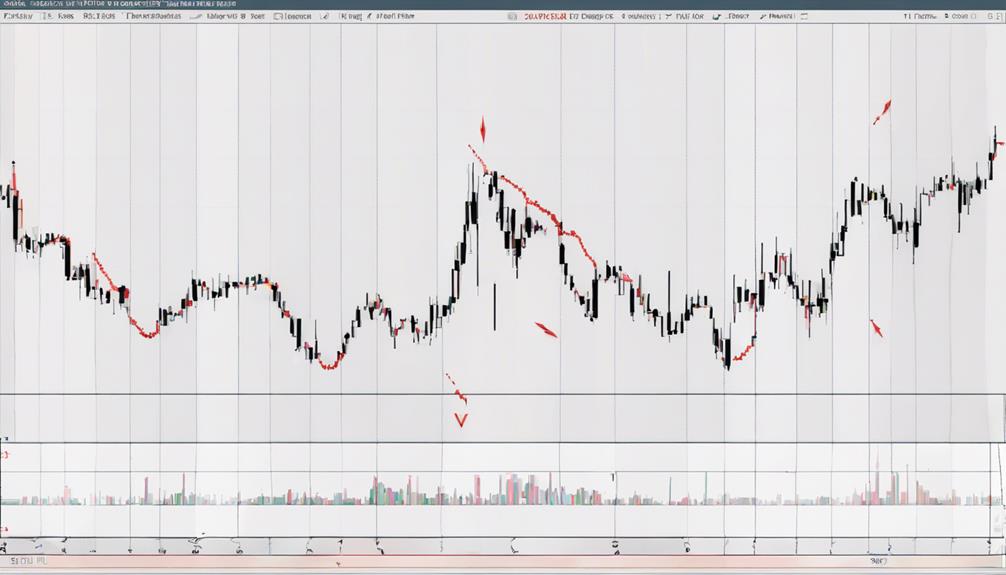
Traders interpret the position of the Parabolic SAR dots relative to price bars to determine the prevailing trend. Dots above the price bars suggest a bearish trend, while dots below indicate a bullish trend. By understanding the relationship between the indicator dots and price movement, traders can capture trend moves and effectively place trailing stops based on the Parabolic SAR signals. Mastering the basics of the Parabolic SAR indicator is crucial for traders looking to make informed decisions and manage risk in dynamic market conditions.
Identifying Trend Reversals
When observing market dynamics through the lens of technical analysis, a critical aspect lies in the precise identification of trend reversals, a pivotal skill that can greatly enhance a trader's ability to capitalize on evolving market conditions.
To effectively identify trend reversals using the Parabolic SAR indicator, traders should consider the following:
- Parabolic SAR Dots Switching Position: Watch for the Parabolic SAR dots switching from above to below the price bars, signaling a potential uptrend reversal.
- Confirmation through Price Bars: Confirmation of a trend reversal occurs when price bars move across the Parabolic SAR dots, indicating a shift in trend direction.
- Identifying Key Reversal Points: Utilize the Parabolic SAR to pinpoint key trend reversal points, which are crucial for maximizing trading opportunities and making informed decisions on entry and exit points.
Entry and Exit Point Strategies
To optimize trading decisions and capitalize on market movements effectively, implementing strategic entry and exit point strategies based on the signals provided by the Parabolic SAR indicator is paramount.
The Parabolic SAR signals entry points when the price crosses above the SAR dots, indicating a potential uptrend. Conversely, exit points are signaled when the price crosses below the SAR dots, suggesting a possible trend reversal or downtrend.
Traders often utilize Parabolic SAR for trailing stops in trending markets to capture profits while remaining within the trend. This indicator aids in avoiding premature exits by offering dynamic stop-loss levels that adjust based on price movements.
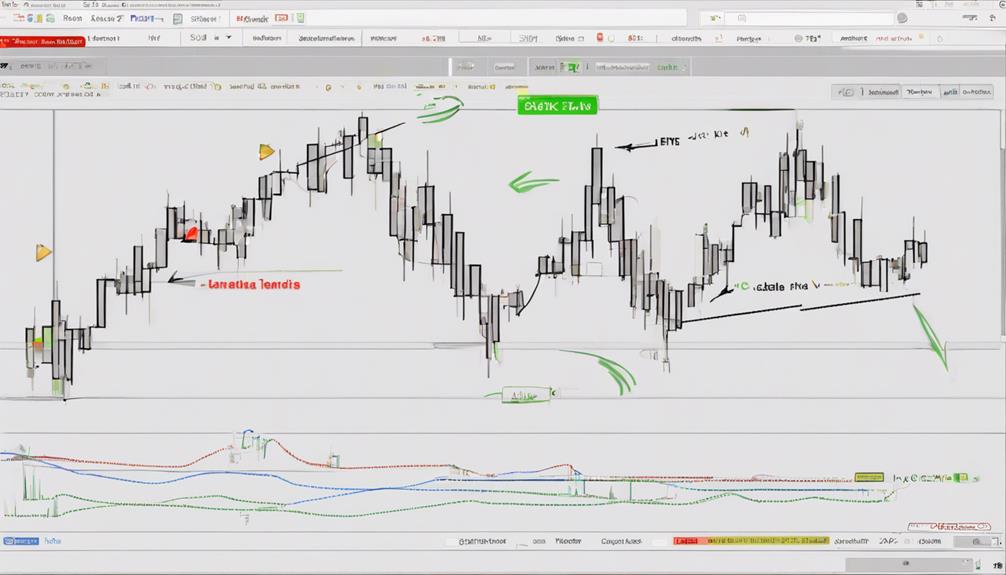
Additionally, combining Parabolic SAR with other indicators can enhance entry and exit strategies, leading to more accurate trading decisions. By incorporating these techniques, traders can navigate the market efficiently, especially during uptrends, where the Parabolic SAR proves particularly useful for guiding entry and exit points.
Implementing Parabolic SAR Effectively
Implementing the Parabolic SAR indicator effectively involves strategically integrating it with complementary technical tools to enhance trading decisions and risk management.
When utilizing Parabolic SAR in trading strategies, consider the following:
- Utilize Stop-Loss Orders: Set stop-loss orders based on Parabolic SAR signals to effectively manage risk and protect profits.
- Combine with Other Indicators: Enhance the effectiveness of Parabolic SAR by combining it with other technical indicators for confirmation of trend directions.
- Identify Entry and Exit Points: Use Parabolic SAR to identify potential entry and exit points based on trend changes, aiding in making informed trading decisions.
Avoiding Common Pitfalls

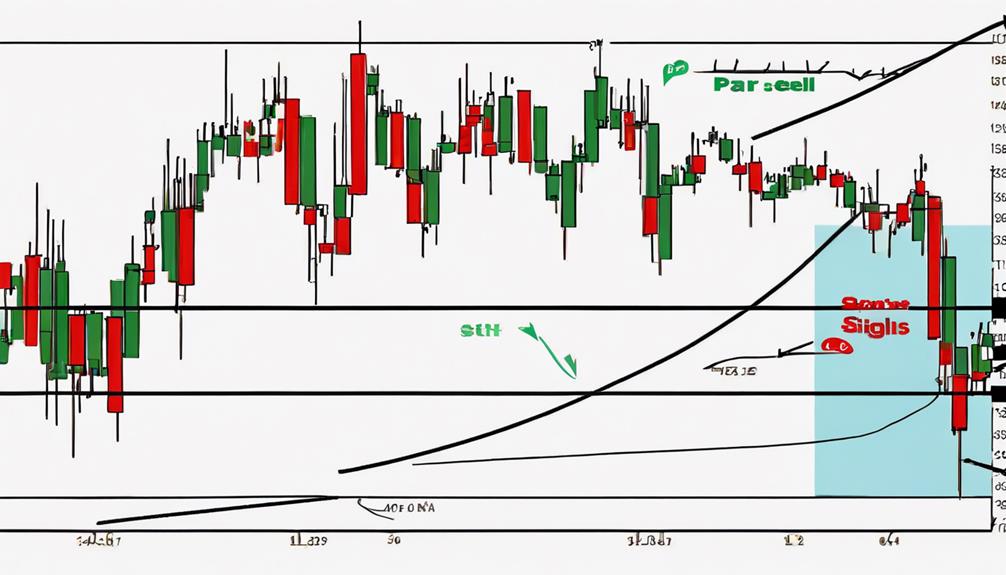
Navigating the complexities of market dynamics, traders must exercise caution to avoid common pitfalls associated with the application of the Parabolic SAR indicator. One significant pitfall is encountering false signals, especially prevalent in sideways markets where the indicator may generate inaccurate buy or sell indications due to price fluctuations within a range-bound market. To mitigate this risk, traders should refrain from solely relying on Parabolic SAR in choppy or ranging conditions. Incorporating additional indicators such as the Moving Average Convergence Divergence (MACD) can serve as a valuable tool to confirm Parabolic SAR signals, helping traders avoid potential trading errors.
Adapting the trading strategy to prevailing market conditions is essential for maximizing the effectiveness of Parabolic SAR. Recognizing the limitations of the indicator and utilizing it in conjunction with other tools can significantly enhance trading decisions. By understanding when to rely on Parabolic SAR and when to seek confirmation from complementary indicators, traders can navigate the markets more effectively and make well-informed trading choices.
How Can I Use the Parabolic SAR Indicator to Decode Signals?
The parabolic SAR indicator benefits traders by providing clear signals for entry and exit points. By placing dots above or below the price, it helps decode the trend direction. When the price is above the dots, it’s a signal to buy, and when below, it’s a signal to sell.
Frequently Asked Questions
How Do You Read a Parabolic SAR Indicator?
When reading a Parabolic SAR indicator, observe its dots' position relative to price bars. Dots above signify a downtrend, below represent an uptrend. Trend shifts occur when dots switch sides. The dot-bar distance gauges trend strength and volatility for strategic trading decisions.
Which Indicator Is Best With Parabolic Sar?
When selecting an indicator to complement Parabolic SAR, consider the Moving Average Convergence Divergence (MACD). It enhances trend reversal confirmation. Combining Relative Strength Index (RSI) can offer oversold/overbought insights. The Average Directional Index (ADX) aids in trend strength evaluation.
How Accurate Is the Parabolic SAR Indicator?
The Parabolic SAR indicator's accuracy varies with market conditions and settings. Traders should backtest strategies to optimize accuracy. For example, in a trending market, Parabolic SAR may provide more reliable signals compared to a ranging market.
What Timeframe Is Best for Parabolic Sar?
The best timeframe for Parabolic SAR depends on trading style, risk tolerance, and the asset. Shorter timeframes like 15-minute charts suit day trading, while daily or weekly charts are ideal for swing trading or long-term investing. Experimentation is key for optimal usage.
Conclusion
In conclusion, the Parabolic SAR indicator offers valuable insights into market trends and potential reversals. Through a systematic analysis of its components and application in trading strategies, traders can enhance their decision-making process and maximize profit potential.
By exploring the effectiveness of integrating Parabolic SAR with other indicators and adapting to market conditions, traders can navigate complex market dynamics with precision and confidence.
The truth of this theory lies in the empirical evidence of its impact on trading outcomes.