
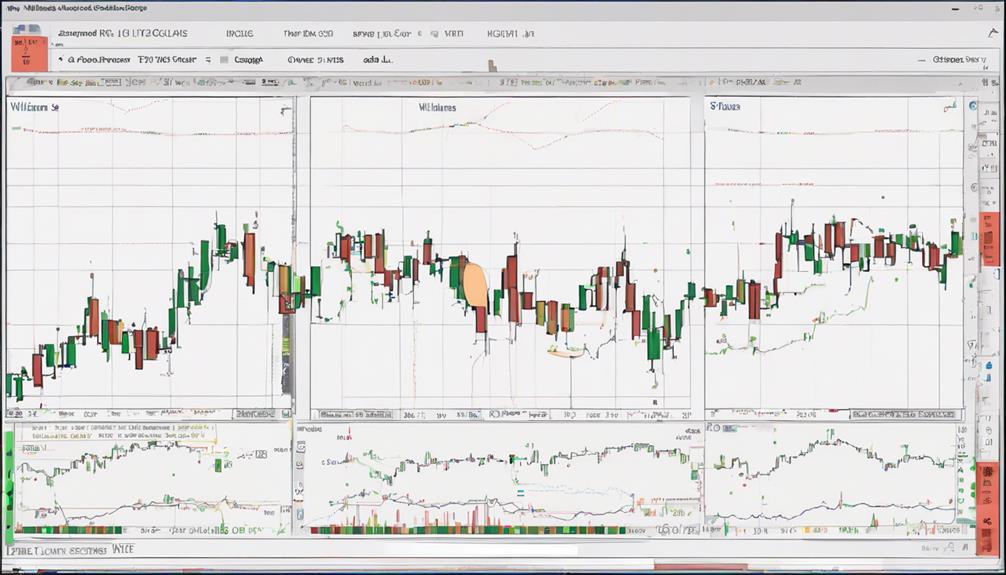
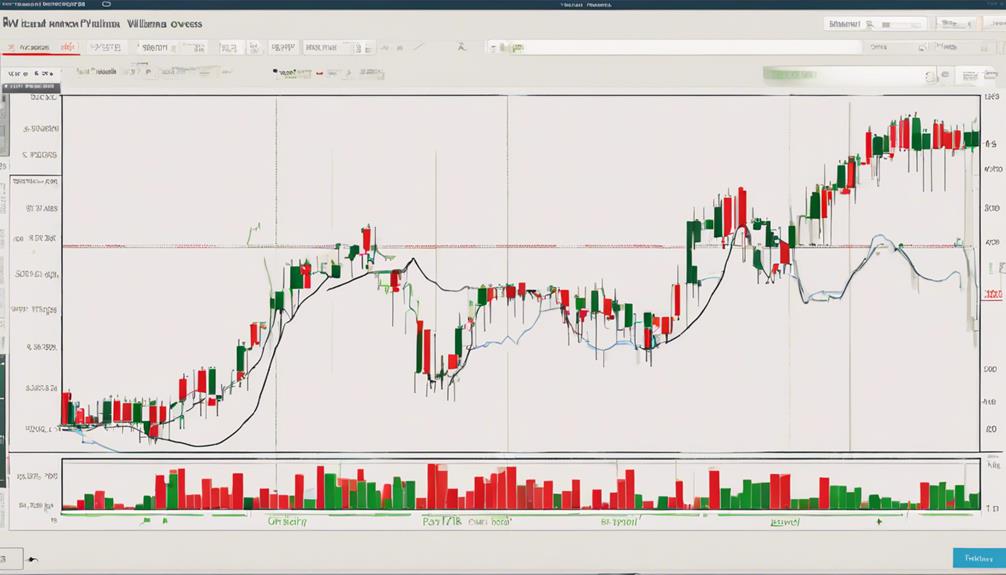
Exploring the intricacies of technical analysis through the lens of Williams %R unveils a structured approach to market evaluation. The 7 steps involved in utilizing this indicator offer a systematic method for traders to gauge potential market reversals and continuations.
By carefully dissecting each step, traders can unlock a deeper understanding of how Williams %R functions within the realm of technical analysis. As we navigate through the nuances of these steps, a clearer picture emerges, shedding light on the power behind this tool and its implications for informed decision-making in the ever-evolving landscape of trading strategies.
Understanding Williams %R Calculation
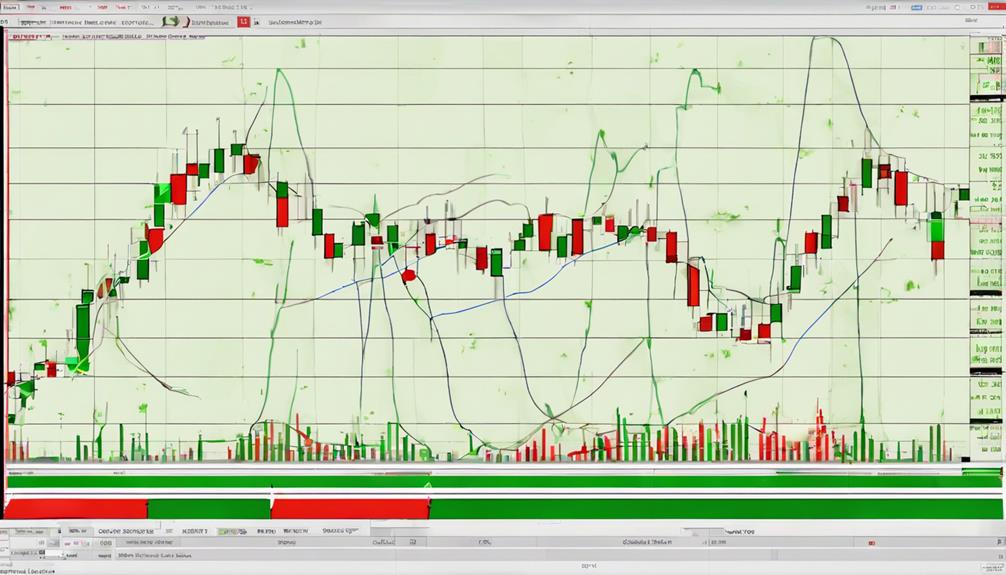
Williams %R calculation is a key component in technical analysis, providing insight into a stock's relative position within its high-low range. The Williams %R, developed by Larry Williams, is a popular financial indicator used by traders to assess overbought or oversold conditions in the market.
By comparing the current closing price to the highest high and lowest low over a specified look-back period, the Williams %R formula calculates a value that ranges from -100 to 0. Readings above -20 suggest overbought conditions, indicating a potential reversal to the downside, while readings below -80 signal oversold conditions, hinting at a possible upward reversal.
Understanding the intricacies of Williams %R calculation is crucial for traders as it aids in identifying trading opportunities and market conditions based on the indicator's values. It serves as a valuable tool for making informed trading decisions and managing risk effectively in financial markets.
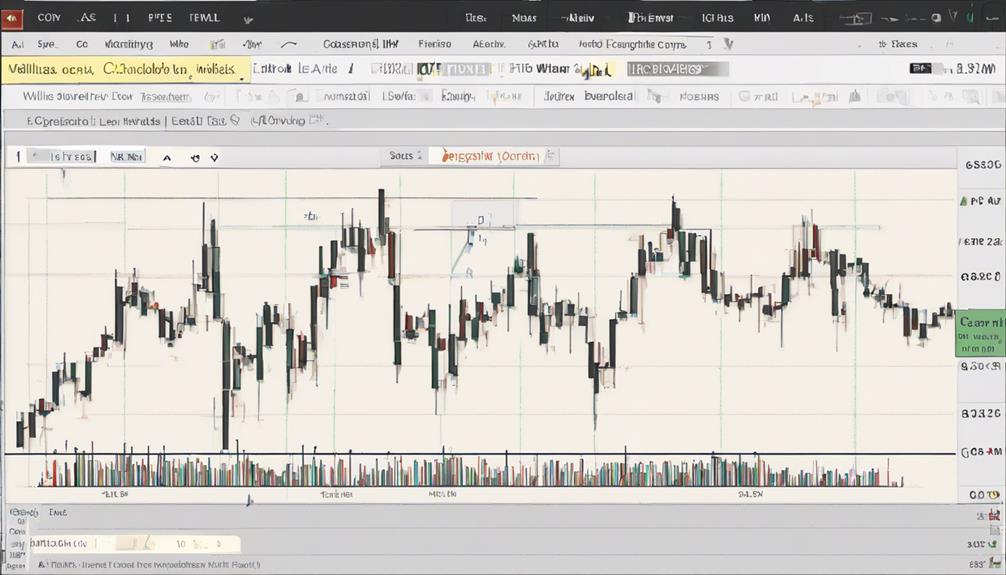
Applying Williams %R in Trading
How can traders effectively utilize the Williams %R indicator in their trading strategies to identify market opportunities and manage risk?
Williams %R is a valuable tool for traders to determine overbought and oversold conditions in the market. By understanding these extremes, traders can make informed decisions on when to enter or exit trades.
The indicator generates trade signals when it moves out of extreme levels. For instance, traders may consider entering long positions when Williams %R rises above -80 and short positions when it falls below -20.
Additionally, incorporating Williams %R with other technical indicators can enhance the accuracy of trading strategies. By analyzing divergence and convergence patterns with Williams %R, traders can potentially identify reversals or confirm trend continuations, thus providing valuable insights for trading decisions.
Interpreting Williams %R Signals
Analyzing Williams %R signals involves understanding basic signal interpretations, recognizing bullish and bearish signals, and effectively timing entry and exit points in the market.
Traders must pay attention to the levels of -20 and -80 as indicators of potential reversals or buying opportunities.
Utilizing Williams %R in conjunction with other technical indicators can provide a more comprehensive view for making informed trading decisions.
Signal Interpretation Basics
Signal interpretation basics for Williams %R involve understanding key thresholds that indicate potential trading opportunities based on overbought and oversold conditions.
Williams %R signals above -20 suggest overbought levels, signaling potential selling opportunities as the price may be due for a correction. Conversely, readings below -80 indicate oversold conditions, presenting potential buying opportunities as the price may have been pushed down to an unsustainable level.
Crosses above -50 on Williams %R may indicate a bullish trend, while crosses below -50 could signal a bearish trend. Additionally, Williams %R can help identify weakening momentum when it fails to move above -20 in uptrends or below -80 in downtrends.
Traders often use Williams %R signals in conjunction with other technical indicators, such as the Fast Stochastic Oscillator, to enhance the accuracy of their trading decisions.
Bullish and Bearish Signals
An essential aspect of interpreting Williams %R signals is recognizing the indications of bullish and bearish trends based on specific thresholds and crossovers. When Williams %R crosses above -50, it suggests a bullish signal, indicating a potential uptrend.
Conversely, a reading below -80 signifies an oversold condition, presenting a possible buying opportunity. Monitoring Williams %R as it moves in and out of the overbought territory (above -20) or oversold territory (below -80) is crucial.
Failure to surpass -20 after being overbought could imply weakening upside momentum, while failure to drop below -80 after being oversold may suggest weakening downside momentum. Utilizing additional technical indicators can help confirm Williams %R signals, enhancing the accuracy of trading decisions.
Timing Entry and Exit
When observing Williams %R signals for timing entry and exit points, traders focus on identifying shifts above -50 for bullish trends and below -50 for bearish trends. Timing entry and exit can be further refined by watching for overbought signals above -20 and oversold signals below -80.
The period of -50 acts as a crucial threshold in determining market sentiment. Utilizing Williams %R in conjunction with other indicators can validate entry and exit signals, enhancing timing precision.
Traders often initiate long positions upon Williams %R crossing above -80 and short positions when it moves below -20. Monitoring how Williams %R reacts to different levels provides valuable insights into trend strength and potential reversal points, aiding traders in making informed decisions.
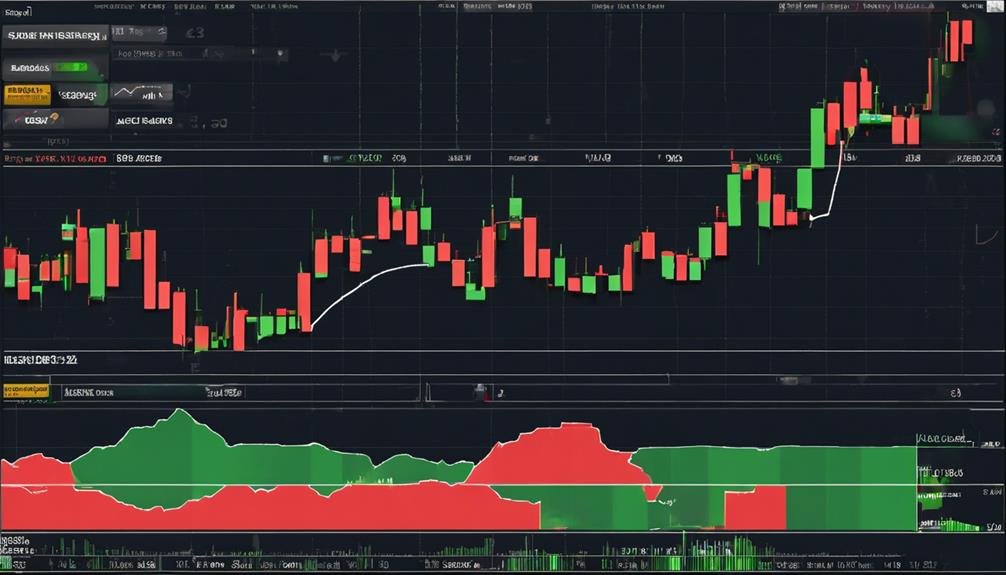
Leveraging Williams %R for Analysis
Utilizing Williams %R as a key technical tool can offer traders valuable insights into market conditions and potential trading opportunities. This indicator moves within a range of 0 to -100, with levels above -20 indicating overbought conditions and levels below -80 signaling oversold conditions.
By utilizing Williams %R, traders can effectively identify overbought and oversold levels, enabling them to generate trading signals based on potential reversals in price action. The comparison of a stock's closing price to its high-low range over a specified period provides traders with valuable information regarding price momentum and potential entry or exit points.
Additionally, combining Williams %R with other technical indicators can enhance the accuracy of trading signals and help confirm market trends, leading to more informed trading decisions. Therefore, leveraging Williams %R for analysis can assist traders in making strategic and well-informed trading choices based on the insights provided by this powerful technical tool.
Utilizing Williams %R in Strategies
Incorporating Williams %R into trading strategies can significantly enhance the ability to identify optimal entry and exit points in financial markets. By utilizing this powerful indicator, traders can make more informed decisions based on overbought or oversold conditions and the interaction with moving averages.
Here are key ways to leverage Williams %R effectively:
- Identifying Overbought or Oversold Levels: Williams %R can signal potential buy opportunities when it moves below -80, indicating an oversold condition, and sell opportunities when it moves above -20, suggesting an overbought scenario.
- Enhancing Signals with Moving Averages: Combining Williams %R with moving averages can provide additional confirmation for trade signals, increasing the reliability of buy or sell decisions.
- Utilizing Williams %R for Trend Analysis: Traders can use Williams %R to identify trend reversals or continuations, assisting in determining the optimal timing for entering or exiting trades based on the stocks' closing price dynamics.
Evaluating Williams %R Advantages and Disadvantages
Given the practical applications of Williams %R in trading strategies, it is imperative to critically evaluate the advantages and disadvantages associated with this technical indicator. Developed by Larry Williams, Williams %R offers a straightforward approach to identifying overbought and oversold levels in the market, aiding traders in making timely decisions. By signaling potential reversals or trend continuations, it provides valuable insights for technical analysis.
However, one must be cautious as the indicator may produce false signals, especially in highly volatile market conditions. To mitigate this risk, traders often combine Williams %R with other technical indicators to enhance its effectiveness. It is essential to recognize that while Williams %R can be a powerful tool, its accuracy is further validated when used in conjunction with other tools for confirmation and increased precision in trading decisions.
When employed judiciously, taking both its advantages and disadvantages into account, Williams %R can be a valuable asset in a trader's toolkit.
Implementing Williams %R in Trading Plans
Implementing Williams %R in trading plans allows traders to effectively identify overbought and oversold conditions, aiding in strategic decision-making based on market sentiment.
When integrating Williams %R into trading strategies, traders can:
- Utilize the High for the Lookback Period: By calculating the highest high in the lookback period for the Williams %R formula, traders can gauge the current security's performance relative to past highs. This can help in identifying potential overbought conditions.
- Identify Oversold Territory: When the Williams %R value crosses below the -80 threshold, it may signal a potential oversold condition. Traders can use this information to consider entry points or potential reversals in the market trend.
- Determine if a Security is Overbought: Williams %R crossing above -20 could indicate that a security is overbought. This insight can assist traders in making informed decisions regarding potential exits or profit-taking strategies.
– Can Following Williams %R Signals Help with Technical Analysis?
Understanding Williams %R signals is crucial for effective technical analysis. Following these signals can provide valuable insights into market trends and potential price reversals. By interpreting the signals accurately, traders can make informed decisions and improve their trading strategies.
Frequently Asked Questions
What Is the Williams %R Strategy?
The Williams %R strategy is a momentum indicator used in technical analysis to identify overbought and oversold conditions in trading markets. It compares the current closing price to the high and low prices over a specific period, aiding traders in making informed decisions.
How to Learn Technical Analysis Step by Step?
To learn technical analysis step by step, start with understanding basic concepts like support and resistance, trendlines, and chart patterns. Then delve into indicators like moving averages and RSI. Practice on demo accounts for hands-on experience.
What Is the Best Setting for Williams R?
The best setting for Williams %R is crucial for effective technical analysis. A 14-day look-back period is commonly recommended, balancing sensitivity and stability. Traders often experiment with different periods like 9 or 21 days to align with their strategy's needs.
What Is the Formula for the Williams %R Indicator?
The formula for the Williams %R indicator calculates the percentage difference between the highest high and the current closing price, indicating overbought or oversold conditions. It is a compass guiding traders through market waters.
Conclusion
In conclusion, the utilization of Williams %R in technical analysis offers a comprehensive approach to identifying potential market trends and reversals.
By understanding the calculation, application, interpretation, and advantages of this indicator, traders can make informed decisions based on data-driven analysis.
It serves as a valuable tool in developing trading strategies and plans, enhancing overall trading accuracy and success in the financial markets.