
When it comes to utilizing trend-following indicators, you may find the idea overwhelming with the multitude of options available. However, by breaking down the process into simple steps, you can effectively incorporate these tools into your trading routine.
By mastering the basics of Simple Moving Averages (SMA) and Exponential Moving Averages (EMA), you lay a strong foundation for understanding more advanced indicators like the Average Directional Index (ADX/DMS) and Moving Average Convergence-Divergence (MACD). These indicators hold the key to unlocking valuable insights into market trends and potential entry points, setting the stage for informed decision-making and strategic trading moves.
Understanding Simple Moving Average (SMA)
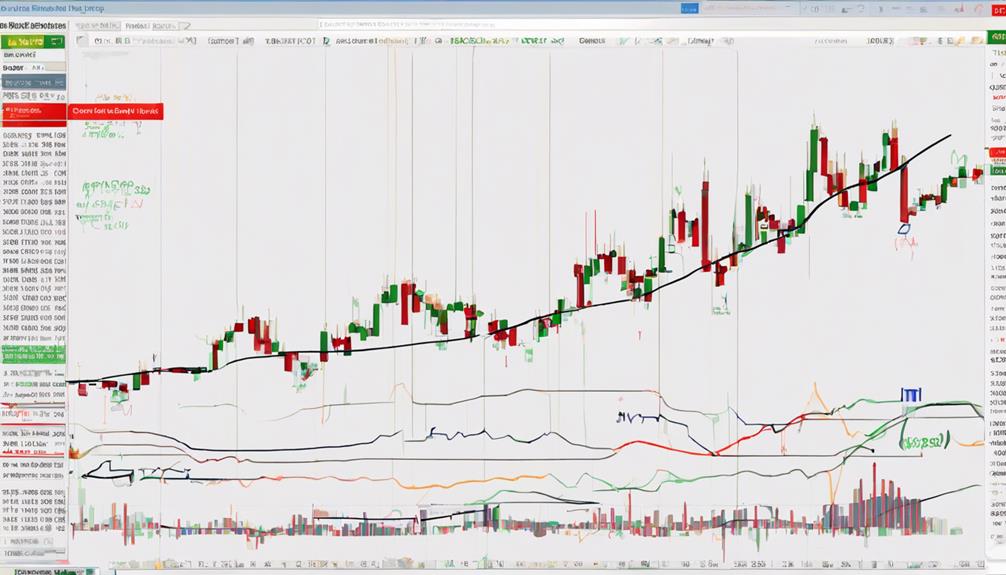
When utilizing trend following indicators, understanding the Simple Moving Average (SMA) is crucial for assessing trend strength and filtering out market noise. SMA calculates the average price of an asset over a specific period, smoothing out price fluctuations to determine the overall asset direction.
Traders commonly use the 50-day, 100-day, and 200-day SMAs to identify short, medium, and long-term trends. While SMA is less responsive to recent price changes compared to Exponential Moving Average (EMA), it's valuable for trend continuation or reversal analysis.
SMA plays a vital role in technical analysis by helping traders focus on the underlying trend of an asset, making it an essential tool for those looking to make informed decisions based on market trends.
Utilizing Exponential Moving Average (EMA)
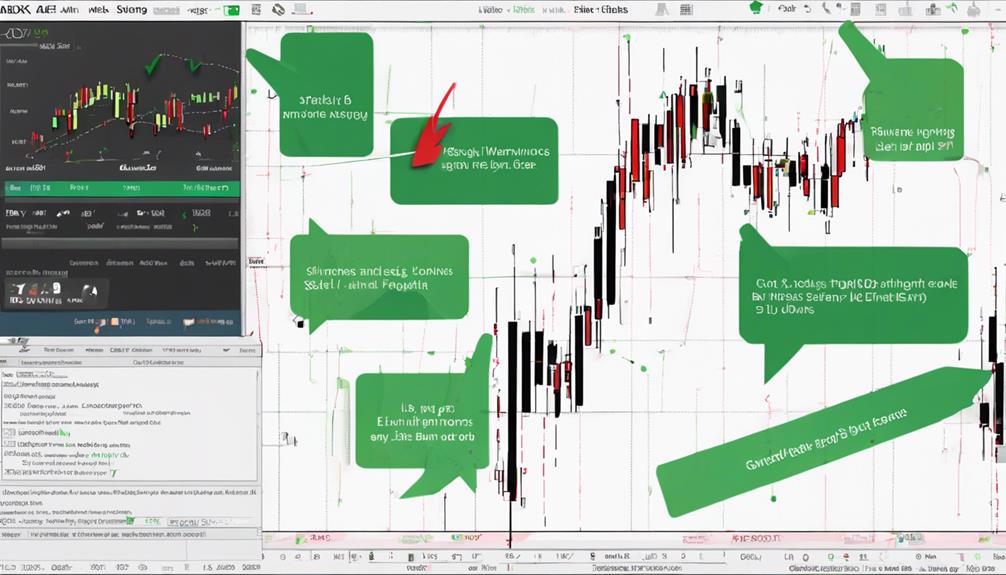
To effectively utilize Exponential Moving Average (EMA) in your trading strategy, consider its ability to provide quicker trend identification by assigning more weight to recent price data. When implementing EMA, keep in mind the following key points:
- EMA responds faster to price changes than Simple Moving Average (SMA).
- EMA crossovers can indicate potential trend reversals or continuations.
- Popular EMA combinations like the 20-day and 50-day EMAs are useful for identifying short-term trends.
- EMA may produce more false signals in choppy or rangebound markets compared to SMA.
- Use EMA in conjunction with other indicators to confirm signals and filter out noise, especially in volatile market conditions.
Applying Average Directional Index (ADX/DMS)
Incorporate the Average Directional Index (ADX/DMS) into your trading strategy to assess trend strength efficiently and make informed decisions based on directional movement indicators.
ADX, comprised of the positive directional indicator (+DMI) and negative directional indicator (-DMI), helps determine the strength of trends. ADX values below 25 indicate weak trends or sideways markets, while values above 25 suggest strong trends are in place.
A reading where +DMI is above -DMI signals an uptrend's strength, whereas +DMI below -DMI indicates a downtrend's strength. Traders often wait for ADX to rise above 25 to confirm a trend's presence before implementing trend-following strategies.
Mastering Moving Average Convergence-Divergence (MACD)
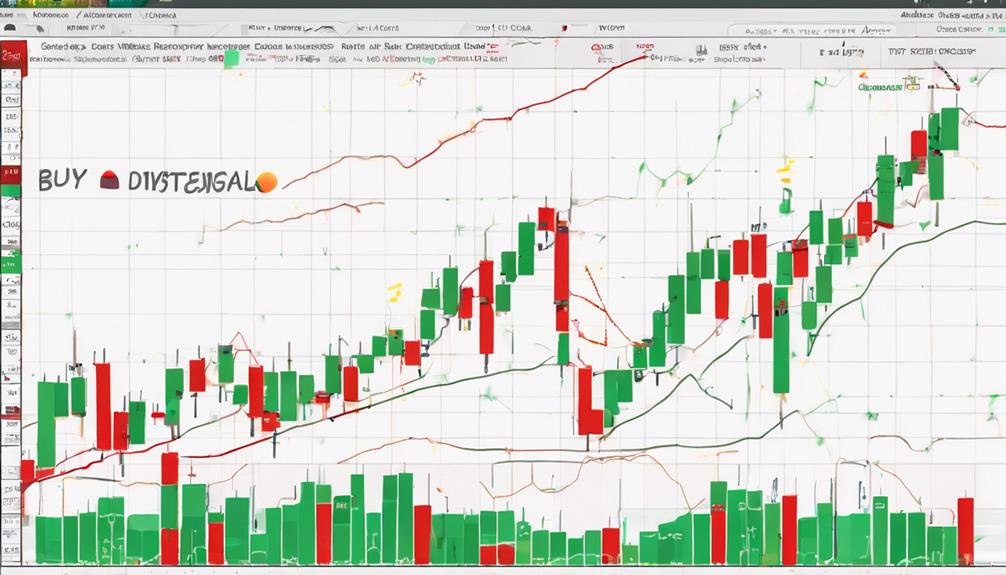
Mastering the Moving Average Convergence-Divergence (MACD) involves understanding its components and utilizing crossovers to identify trading opportunities efficiently.
- The MACD is a trend-following and momentum indicator with two lines: MACD line and signal line.
- MACD line is calculated by subtracting the 26-day EMA from the 12-day EMA.
- Signal line, a 9-day EMA of the MACD line, is crucial for generating buy and sell signals.
- MACD lines above zero signal an uptrend, while below zero indicate a downtrend.
- Traders often seek crossovers between the MACD line and the signal line to spot potential opportunities for entering or exiting trades.
Leveraging Parabolic Stop and Reverse (Parabolic SAR)
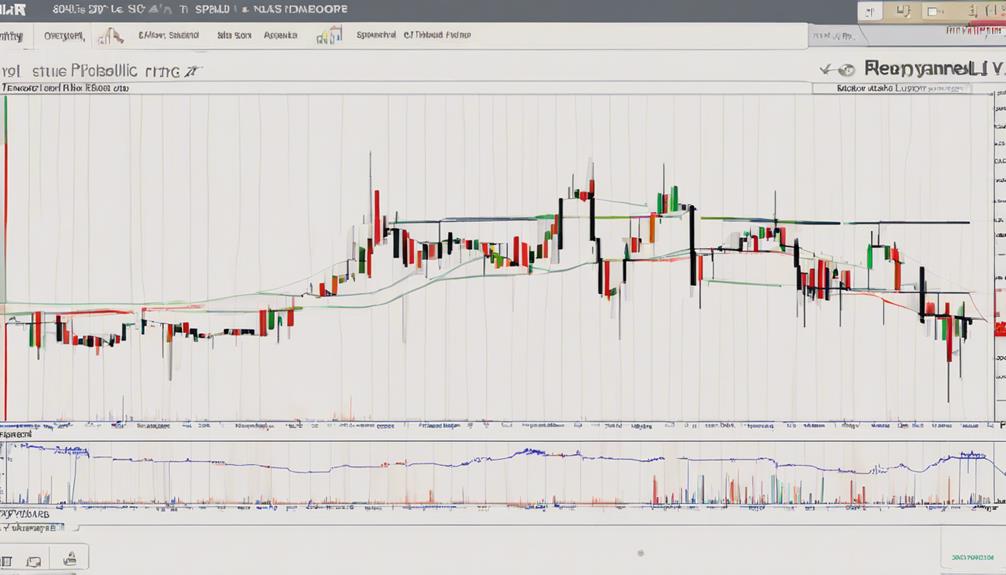
When utilizing the Parabolic Stop and Reverse (Parabolic SAR) indicator, traders can benefit from its trend-confirming capabilities and reversal signals within specific time frames. This trend-following indicator is most effective in strong trending markets, providing clear signals for trend direction.
However, in sideways conditions, its reliability diminishes. To enhance accuracy, traders often combine Parabolic SAR with other indicators or price patterns. The indicator's dots above or below price bars indicate potential trend changes, helping traders decide on entering or exiting trades.
Understanding the relationship between price movements and the Parabolic SAR dots is crucial for making informed trading decisions. By leveraging the Parabolic SAR effectively, traders can improve their ability to navigate various market conditions and capture profitable trading opportunities.
Are There Different Ways to Utilize Trend Following Indicators?
Yes, there are different ways to utilize simple trend following indicators. Traders can use them to identify market trends, determine entry and exit points, and set stop-loss levels. Additionally, these indicators can be applied to various financial instruments, including stocks, forex, and commodities.
Frequently Asked Questions
How Do You Use a Trend Indicator?
To use a trend indicator effectively, you analyze crossovers and slopes of moving averages for buy or sell signals. Interpret MACD for momentum and RSI for overbought/oversold conditions. OBV correlates volume with price movements for trend confirmation.
What Is a Simple Trend-Following Strategy?
To implement a simple trend-following strategy, you buy in uptrends and sell in downtrends, akin to riding a wave. Utilize indicators like moving averages, MACD, RSI, and OBV to confirm trends. Focus on following market trends rather than predicting reversals for potential profit maximization.
What Is the Easy Trend Indicator?
The Easy Trend Indicator is a user-friendly tool for identifying market trends. It guides you in recognizing whether prices are moving up, down, or sideways. Traders of all levels can rely on its signals to make strategic trading decisions.
How Do You Learn Trend-Following?
You learn trend-following by grasping market direction, applying indicators like moving averages or RSI, and refining strategies through practice. Manage risks with stop-loss orders and adapt to market changes for enduring trading success.
Conclusion
In conclusion, by mastering trend-following indicators such as SMA, EMA, ADX/DMS, MACD, and Parabolic SAR, you can enhance your trading strategy and capitalize on market trends effectively.
These tools provide valuable insights into price movements and trend strengths, guiding your decision-making process for optimal entry and exit points.
With these simple steps, you'll be on your way to becoming a trend-following expert, ready to conquer the trading world with unparalleled precision and success.