
Have you ever felt overwhelmed by the intricacies of technical analysis tools?
Imagine simplifying your trading approach by understanding a single indicator that can offer comprehensive insights into market trends and potential price movements.
The Ichimoku Cloud does just that, but how exactly can it help you make informed trading decisions with ease?
Let's explore how mastering this powerful tool could transform your trading strategy and elevate your success in the dynamic world of financial markets.
Ichimoku Cloud Indicator Basics
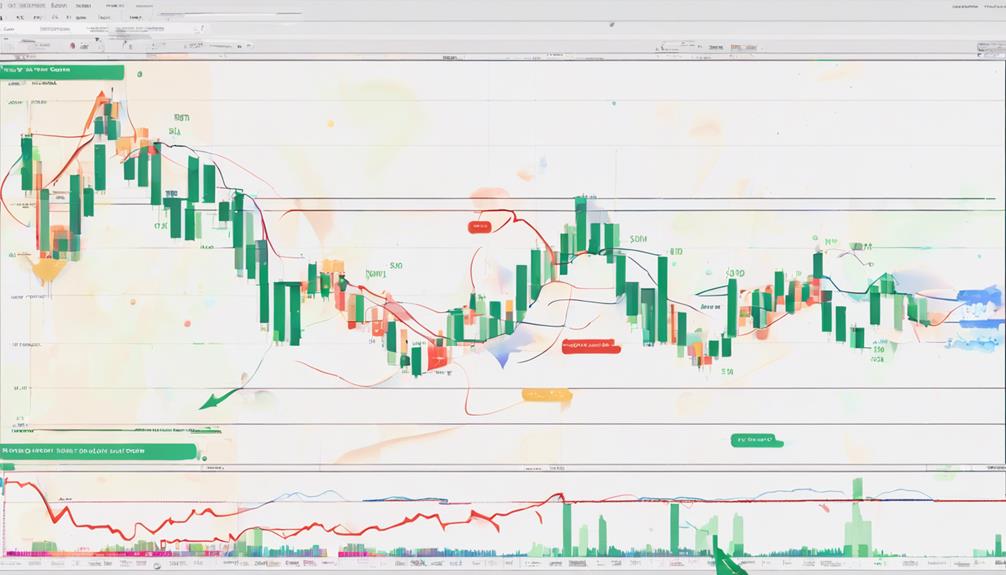
To grasp the essence of the Ichimoku Cloud Indicator Basics, focus on how it swiftly synthesizes price dynamics for traders. The Ichimoku Cloud, a comprehensive trading indicator, incorporates various components such as the Tenkan-sen, Kijun-sen, Senkou Span A and B, and Kumo to provide a holistic view of price movements.
This indicator not only identifies support and resistance levels but also offers insights into potential trend reversals. By analyzing the thickness of the Kumo within the Ichimoku Cloud, traders can gauge the strength of these support and resistance zones.
The Ichimoku Cloud is particularly useful for detecting the overall trend direction as well as generating buy or sell signals based on the moving averages and price action data.
Understanding Conversion and Base Lines
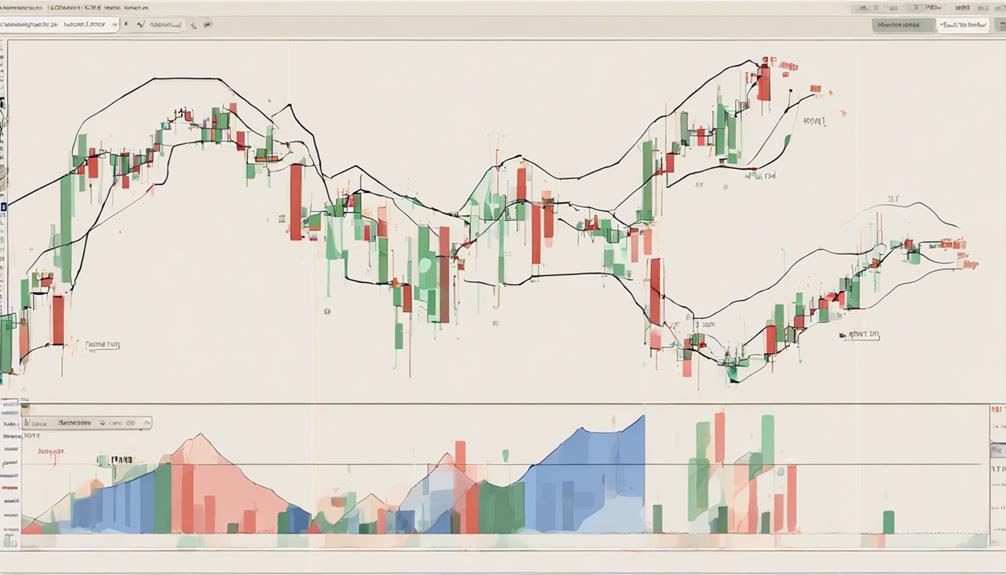
The Conversion and Base Lines in the Ichimoku Cloud indicator serve as crucial dynamic support and resistance levels that play a significant role in analyzing price movements.
The Conversion line is calculated from the average of the 9-period high and low, while the Base line is derived from the average of the 26-period high and low. These lines act as key support and resistance levels.
Crosses between the Conversion and Base lines provide momentum signals and indicate the trend direction. Traders often observe the relationship between these lines to make informed trading decisions.
Understanding the interplay between the Conversion and Base lines is essential for interpreting Ichimoku Cloud signals accurately and effectively.
Interpreting Ichimoku Cloud Signals
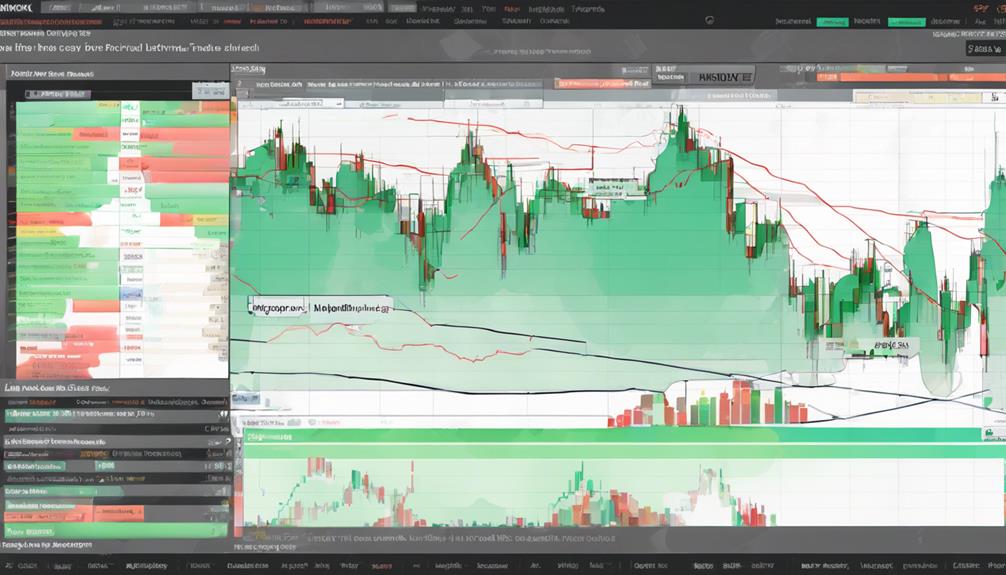
Interpreting Ichimoku Cloud Signals involves analyzing key components such as price position relative to the cloud, crossover signals, and Chikou Span's confirmation of trends. The Ichimoku Cloud consists of various lines that traders use to interpret market conditions. When the price is above the cloud, it signals a bullish trend; when below, a bearish trend.
Crossovers between the Tenkan Sen and Kijun Sen lines within the cloud provide buy or sell signals. Traders also look at the Chikou Span to confirm trends by comparing its current position to past price action. The thickness of the cloud indicates the strength of support and resistance levels.
Utilizing Ichimoku Cloud for Trading
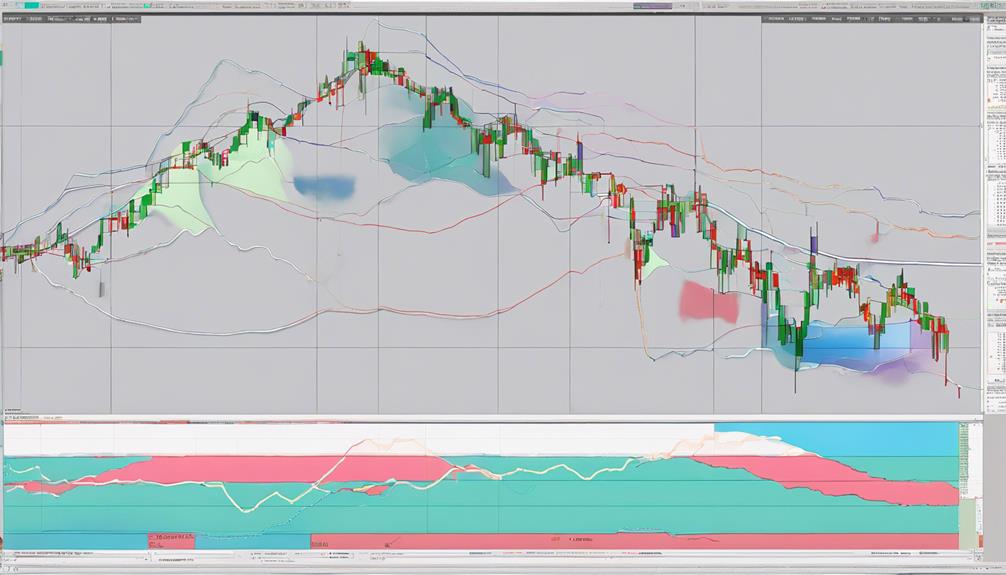
Considering the components of the Ichimoku Cloud system, you utilize its various elements for comprehensive market analysis and strategic trading decisions.
The Tenkan-Sen and Kijun-Sen crossovers provide entry/exit signals, while the Chikou Span breaking above or below the cloud confirms trend strength.
The color and thickness of the cloud indicate trend direction and volatility levels, aiding in making informed trading choices.
By combining Ichimoku Cloud with other indicators, you can enhance accuracy and adapt to different market conditions effectively.
Understanding how these elements work together enables you to gauge market sentiment and make well-informed trading decisions based on the prevailing trend strength and volatility levels in the market.
Risk Management With Ichimoku Cloud
Enhance your risk management strategy effectively with Ichimoku Cloud by identifying key support and resistance zones for setting stop-loss levels. By utilizing the Cloud's ability to analyze price action, you can manage risk effectively and protect trading capital.
The Cloud thickness serves as a tool to gauge market volatility, allowing you to adjust risk exposure accordingly. Understanding the key support and resistance zones provided by Ichimoku Cloud aids in establishing appropriate stop-loss levels to mitigate potential losses.
Incorporating Ichimoku Cloud into your risk management approach not only enhances your decision-making process but also ensures that you're well-equipped to navigate various market conditions successfully. Take advantage of this technical indicator to safeguard your trades and optimize your risk management practices.
>Is It Possible to Understand Ichimoku Cloud Easily without Mastering It?
Understanding Ichimoku Cloud can initially seem complex, but with a structured approach, you can grasp its essentials. The “stepbystep ichimoku cloud mastery” method breaks down the indicator’s five main lines and concepts into manageable segments, allowing for easier comprehension before achieving full mastery.
Frequently Asked Questions
How to Interpret Ichimoku Cloud?
To interpret the Ichimoku Cloud effectively, observe crossovers of the Tenkan-Sen and Kijun-Sen lines within the cloud for trading signals. Analyze cloud color for trend direction and thickness for support/resistance strength. Chikou Span confirms trends.
What Is the Basic Ichimoku Strategy?
To grasp the basic Ichimoku strategy, focus on the Tenkan-Sen and Kijun-Sen lines for trend recognition. Identify buy/sell signals through their crossovers. Confirm with Chikou Span analyzing past prices. Utilize Kumo for entry/exit points.
What Is the Best Indicator to Use With Ichimoku Cloud?
When trading with Ichimoku Cloud, the Relative Strength Index (RSI) is an ideal companion. RSI complements Ichimoku signals by pinpointing overbought or oversold conditions, confirming trends, and enhancing risk management. Combine them for robust trading decisions.
What Is the Best Timeframe to Use Ichimoku?
For the best timeframe with Ichimoku, consider your goals and style. Shorter periods like 15-minutes give active signals, while daily or weekly charts offer solid trends. Experiment to match your strategy and objectives effectively.
Conclusion
In conclusion, mastering the Ichimoku Cloud indicator is like having a powerful compass guiding you through the ever-changing financial markets.
By understanding its components and signals, traders can navigate trends, identify potential entry and exit points, and manage risks effectively.
Combining this tool with other indicators like RSI can enhance trading strategies and improve decision-making.
With practice and dedication, the Ichimoku Cloud can become a valuable asset in your technical analysis toolkit.