
When it comes to navigating the complexities of the market, the old adage 'knowledge is power' holds especially true. Picture yourself having a tool at your disposal that can offer insights into market movements before they unfold, potentially giving you a competitive edge.
The Advance Decline Line serves as a compass for traders, guiding them through the vast landscape of market prediction. So, how can this seemingly simple indicator provide such valuable foresight into market trends and shifts?
Stay tuned to uncover the hidden power of the Advance Decline Line and how it can transform your trading strategies.
Understanding Advance Decline Line Basics
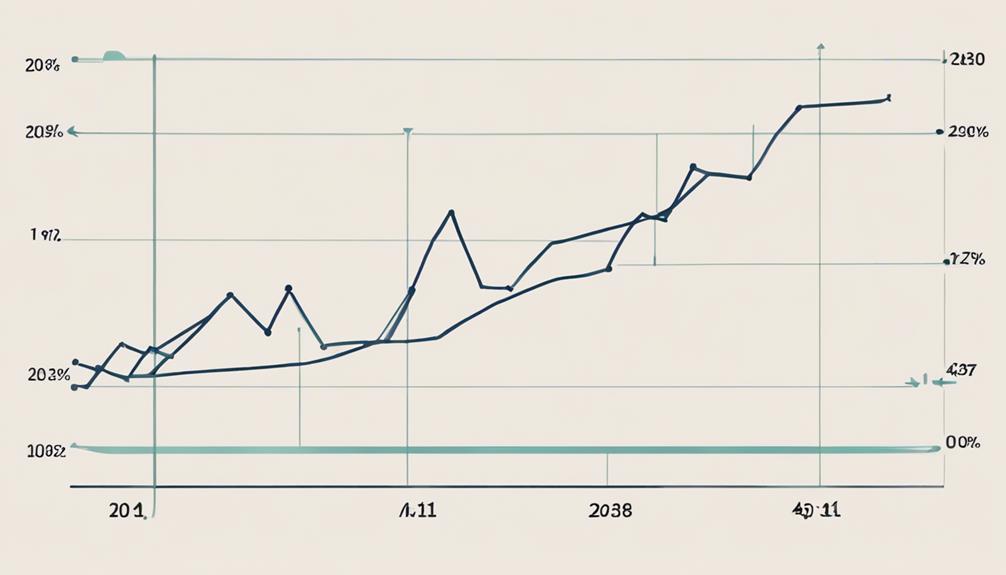
To grasp the fundamentals of the Advance Decline Line (AD Line), one must comprehend how it calculates the disparity between advancing and declining stocks within an index. The AD Line plays a pivotal role in technical analysis by reflecting market breadth, which is essential for evaluating the overall health of the market.
By tracking the number of advancing and declining stocks, the AD Line offers valuable insights into market sentiment, allowing investors to gauge the prevailing trends. Understanding this tool is crucial for devising effective trading strategies and making informed decisions.
Monitoring the AD Line can help traders anticipate potential market reversals based on the balance between advancing and declining stocks, providing a comprehensive view of market dynamics.
Analyzing Market Trends With ADL
As you shift your focus to analyzing market trends with the Advance Decline Line (ADL), a clearer picture of market sentiment emerges through the disparity between advancing and declining stocks in an index.
The ADL, a Technical Analysis breadth indicator, provides valuable insights into the strength of the market by assessing the overall trend of stock movements. By observing the ADL's relationship with the Index, you can gauge the market's direction and potential shifts, making it a crucial tool in Technical Analysis.
Understanding the ADL's signals can help you anticipate trends and identify opportunities for strategic moves in the market. Utilizing ADL effectively enhances your ability to interpret market dynamics and stay ahead in your trading decisions.
Interpreting Bullish and Bearish Signals
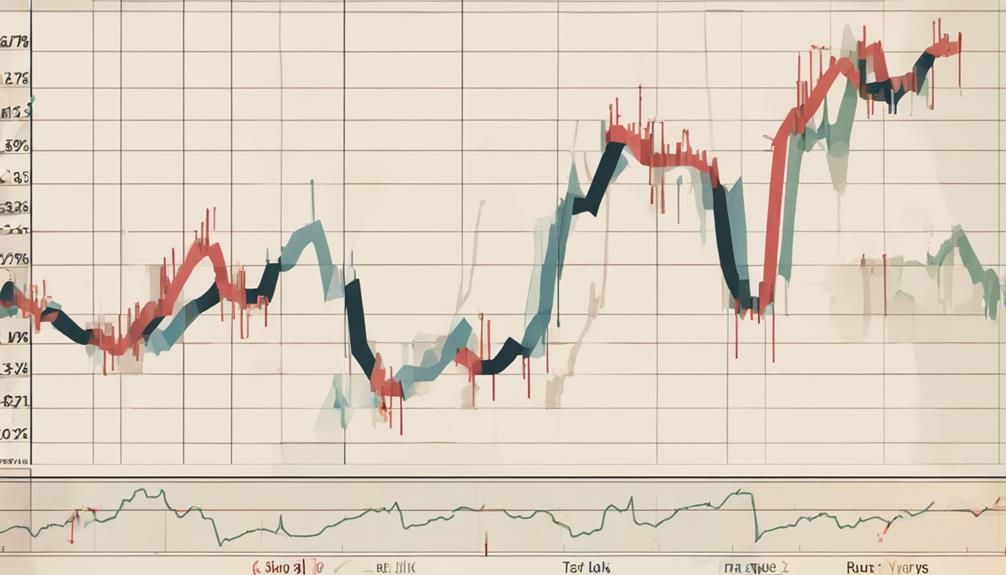
Examining the Advance Decline Line for bullish and bearish signals reveals critical insights into market sentiment and potential trends. Bullish signals manifest when a greater number of stocks are advancing, reflecting positive market sentiment.
Conversely, bearish signals arise when the Advance Decline Line weakens despite rising prices, indicating a potential market correction. Historical examples such as the dot-com bubble and the 2008 crisis underscore the significance of heeding bearish divergence warnings.
Volume trends serve to confirm or refute bearish divergence signals in Advance Decline Line analysis. To navigate bearish signals effectively, consider strategies like reducing equity exposure and employing stop-loss orders for robust risk management in market prediction.
Using Cumulative AD Line for Strength Analysis
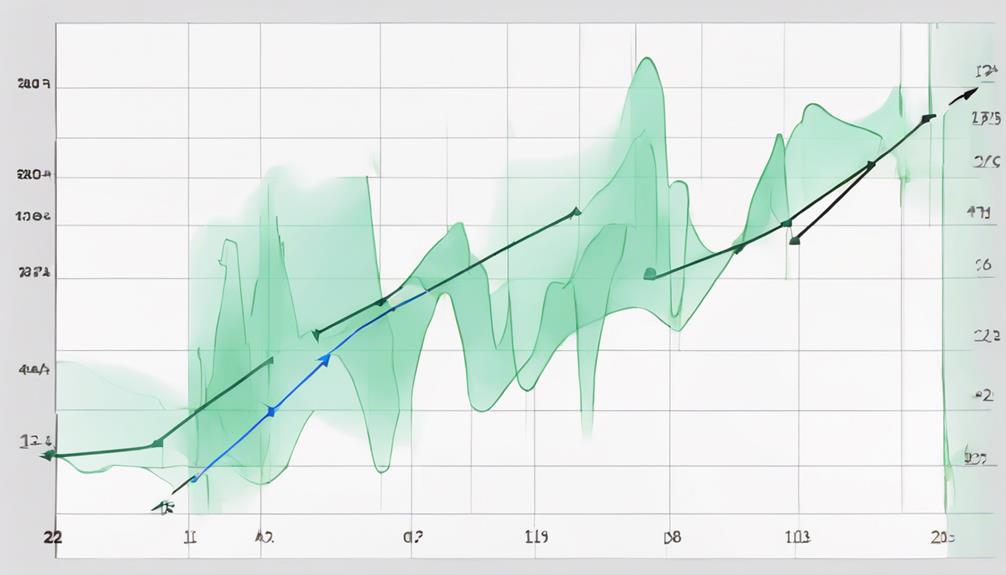
Navigating market sentiment and trends requires a deep understanding of the cumulative AD Line's role in analyzing strength and breadth over time. By utilizing the cumulative AD Line for strength analysis, you can gain valuable insights into market trends and direction.
Here are some key points to consider:
- The cumulative AD Line serves as a long-term measure of market breadth and strength.
- Historical performance indicates its reliability in predicting market trends.
- It isn't foolproof but can offer valuable insights into market direction.
- Combining the cumulative AD Line with other technical indicators is recommended for more robust analysis.
- Understanding the cumulative AD Line is essential in predicting trends accurately and making informed decisions in the market.
How Accurate is the Advance Decline Line in Predicting Market Trends?
The Advance Decline Line is considered one of the best ways for market analysis. It measures the level of participation in a market rally or decline. While not infallible, many traders and analysts trust it as an accurate indicator of market trends, helping to inform their investment decisions.
How Accurate Is the Advance Decline Line for Predicting Market Trends?
The accuracy of market analysis with A/D line in predicting market trends can be substantial. By tracking the number of advancing and declining stocks, the A/D line provides valuable insight into the overall strength of the market. It is a useful tool for identifying potential changes in trend direction.
Leveraging NYSE AD Line in Trading
Leverage the NYSE Advance-Decline (AD) Line effectively to enhance your trading strategy and gain valuable insights into market breadth and strength. By tracking the difference between advancing and declining stocks on the NYSE, traders can interpret the level of participation in price movements, indicating market sentiment.
The NYSE AD Line serves as a leading indicator for potential reversals and market trends, offering a comprehensive view of market dynamics. Analyzing this data alongside price movements can uncover trading opportunities and aid in making informed decisions.
Incorporating the NYSE AD Line with other technical indicators can further refine trading strategies and increase the probability of successful trades in the stock market.
Frequently Asked Questions
What Is the Advance Decline Line Strategy?
The Advance Decline Line (AD Line) strategy is a tool to track the net difference between advancing and declining stocks in an index. It helps you analyze market breadth, predict trends, and make informed trading decisions.
What Is the Advance Decline Line on a Stock Market Chart?
On a stock market chart, the Advance Decline Line (AD Line) visually showcases the relationship between advancing and declining stocks. By observing its trend, you can gauge market breadth and potential shifts in investor sentiment.
What Is the 10-Day Advance Decline Line?
The 10-day Advance Decline Line tracks daily advancing and declining stocks over a 10-day period, helping you analyze short-term market sentiment and trends. It offers insights into recent market movements, aiding in making informed decisions based on short-term trends.
What Is the S&P 500 Advance Decline Line?
The S&P 500 Advance Decline Line measures the net difference between advancing and declining stocks in the S&P 500 index. It offers a snapshot of market breadth and sentiment, aiding in trend confirmation and reversal signals.
Conclusion
As you navigate the complex landscape of market prediction, remember that the Advance Decline Line serves as a guiding light, revealing hidden truths and potential opportunities.
Just as a lighthouse guides ships safely to shore, the ADL illuminates market trends and signals, helping you steer your investments in the right direction.
Embrace the power of this tool, harness its insights, and set sail towards financial success with confidence and clarity.