
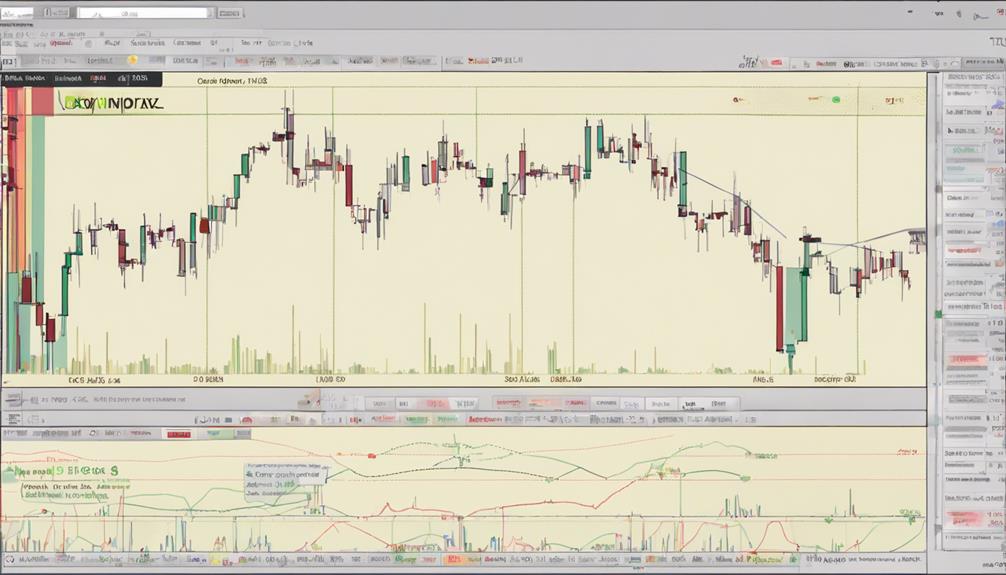
The realm of technical analysis is vast and intricate, with tools like the Average Directional Index (ADX) offering traders a valuable lens through which to interpret market trends and potential trading opportunities.
In the '7 Essential Tips for ADX Technical Analysis Guide,' a comprehensive breakdown of strategic insights awaits those seeking to refine their analytical skills and elevate their trading prowess.
From fundamental ADX principles to advanced techniques and pitfalls to sidestep, this guide holds a roadmap to harnessing the power of ADX for informed decision-making in the dynamic world of trading.
Understanding the ADX Indicator
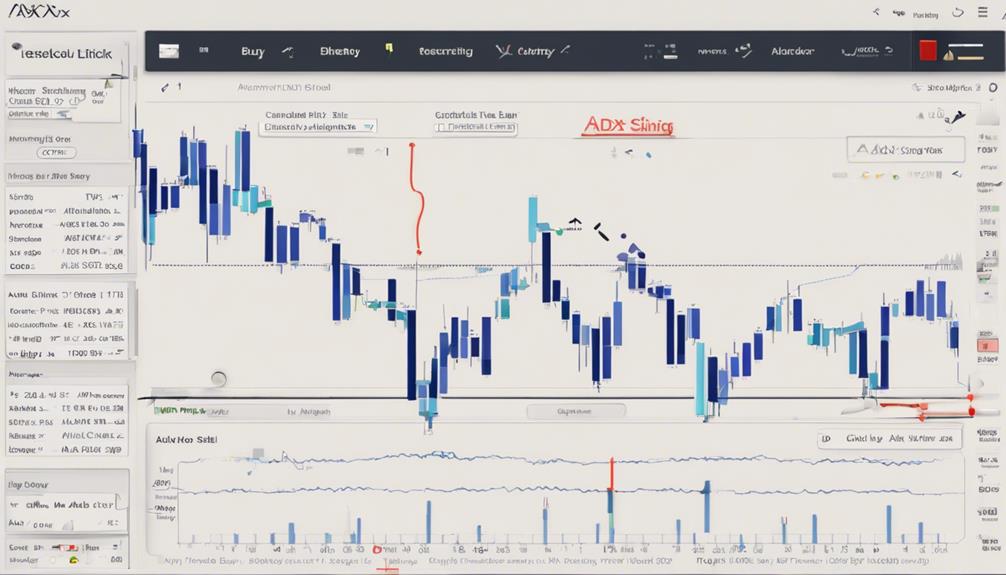
The ADX indicator, a crucial tool in technical analysis, provides traders with a quantitative measure of trend strength across various financial markets. ADX, short for Average Directional Index, evaluates the strength of a trend without regard to its direction. By analyzing price range expansion over a specific period, typically 14 bars by default, traders can assess the momentum behind a particular price movement. ADX values range from 0 to 100, with readings above 25 typically indicating a strong trend in place. This makes ADX a valuable tool for identifying trends suitable for trend-trading strategies.
The ADX indicator is particularly useful in determining the strength of a trend, which is essential for traders looking to gauge the potential profitability of a trade. By incorporating the +DMI (Positive Directional Movement Indicator) and -DMI (Negative Directional Movement Indicator) lines in conjunction with ADX, traders can not only identify the direction of the trend but also confirm its strength. This combination of signals provides traders with a comprehensive view of the market dynamics, allowing for more informed trading decisions based on technical analysis.
ADX Indicator Settings for Day Trading
When considering ADX indicator settings for day trading, the focus lies on determining the optimal period length. In this case, it is commonly set at 3 periods. This setting offers day traders a balance between responsiveness and accuracy in identifying trend strength promptly.
Understanding how to interpret ADX values within this timeframe is crucial for making informed decisions based on trend analysis in fast-moving markets.
Timeframes for ADX
How can the selection of different timeframes influence the effectiveness of ADX indicator settings in day trading strategies? When it comes to ADX indicator trading, the timeframe chosen plays a crucial role in capturing accurate trend signals. Here are key points to consider:
- Day Trading Strategies: Opt for a 3-period ADX setting for intraday trading activities.
- Swing Trading Strategies: Adjust ADX settings based on different timeframes to align with swing trading goals.
- Determining Trend Strength: Utilize a 14-period ADX setting for precise trend strength indications.
- Combining Indicators: Enhance decision-making by combining RSI with ADX to assess trend intensity and potential reversal signals effectively.
Optimal Period Length
In day trading strategies utilizing the ADX indicator, selecting the optimal period length is crucial for accurately assessing trend strength and making timely trading decisions.
For day trading, a period length of 3 periods is often considered optimal as it provides more responsive signals in fast-moving environments.
Traders can customize the ADX period length based on their trading style and time frame preferences to enhance trend analysis and improve entry and exit decisions.
Setting the ADX indicator to a 3-period length enables day traders to swiftly identify strong trends, offering valuable insights into trend strength for effective decision-making in dynamic trading scenarios.
Interpreting ADX Values
To effectively interpret ADX values in day trading, understanding the significance of different levels and selecting appropriate indicator settings is essential for making informed trading decisions based on trend strength. When analyzing ADX readings for day trading strategies, consider the following:
- ADX values below 25 indicate weak trend conditions or a non-trading period.
- A reading above 25 on the ADX signals a strong trend, ideal for day trading strategies.
- The 3-period timeframe is commonly recommended for day trading ADX settings to accurately assess trend strength.
- ADX settings can be customized for swing trading based on preferred time frames to enhance trend analysis precision.
Effective Use of ADX for Swing Trading
Utilizing the ADX indicator effectively in swing trading requires strategic adjustment of the period setting in alignment with the chosen time frame to maximize signal accuracy. For swing traders, a common practice is to use a 14-period setting to capture reliable trends.
ADX values above 25 are considered strong, indicating potential swing trading opportunities. It is beneficial to combine ADX with other indicators like RSI to enhance trend intensity analysis and confirm entry and exit points.
By following ADX rules for swing trading, traders can identify and capitalize on profitable trends more effectively. The ADX serves as a valuable tool in technical analysis for swing traders, offering insights into the strength of trends and assisting in decision-making processes.
Incorporating ADX into swing trading strategies can lead to more informed and profitable trading outcomes.
Combining ADX With Other Indicators
Combining ADX with other indicators such as RSI, MACD, and Stochastics can provide traders with a more comprehensive view of market conditions.
By using ADX in conjunction with these indicators, investors can better gauge trend strength, identify potential reversals, and pinpoint entry/exit points with greater accuracy.
Each indicator brings its unique perspective to the analysis, allowing traders to make more informed decisions based on multiple signals.
Use With RSI
The integration of ADX with RSI offers traders a powerful tool for identifying market trends and potential reversal points. When using ADX and RSI together, traders benefit from a more comprehensive analysis of market conditions.
Here are some key points to consider:
- Combining ADX with RSI helps in recognizing overbought or oversold conditions.
- RSI measures the speed and change of price movements, while ADX quantifies trend strength.
- The synergy between RSI and ADX provides insights into both trend direction and momentum.
- ADX confirms trend strength, while RSI can signal potential reversal points, aiding in making informed trading decisions.
Pair With MACD
When pairing the ADX indicator with MACD, traders can enhance their ability to assess market trends and momentum with greater accuracy. The MACD focuses on identifying trend direction, while the ADX measures trend strength.
By utilizing both indicators simultaneously, traders gain a comprehensive view of market conditions, enabling them to make more informed trading decisions. Cross-referencing MACD crossovers with ADX levels can further enhance trading signals, providing confirmation of potential trend changes or continuations.
The synergy between MACD and ADX contributes to improving the accuracy of trend analysis, offering a more robust framework for understanding market dynamics. This combined approach leverages the strengths of each technical analysis tool to better navigate varying market scenarios and capitalize on trading opportunities.
Combine With Stochastics
Integrating Stochastics with the Average Directional Index (ADX) can provide traders with a comprehensive approach to analyzing market trends and potential trading opportunities. When combining these two indicators:
- Stochastics measures overbought/oversold conditions, while ADX quantifies trend strength.
- Stochastics can help identify potential reversal points, while ADX confirms the trend's strength.
- A crossover between Stochastics and ADX can generate powerful signals for entry/exit decisions.
- Integrating Stochastics with ADX allows traders to filter out false signals, focusing on high-probability trades.
Advanced Analysis Techniques With ADX
Implementing advanced analysis techniques with ADX involves a nuanced interpretation of ADX values in conjunction with directional movement indicators to discern trend direction effectively. The average directional index (ADX) is a key component, acting as a trend strength indicator.
By analyzing the ADX line along with the Directional Movement Index (DMI) lines, traders can determine whether a strong trend is in place, especially when the ADX line is rising. Combining ADX crossovers with indicators like moving averages can help confirm trend strength, while incorporating oscillators such as the Relative Strength Index (RSI) can provide more precise entry and exit signals.
Additionally, utilizing historical ADX data for backtesting strategies and optimizing settings for specific assets is crucial for successful implementation. Furthermore, employing ADX divergence analysis can assist in identifying potential trend reversals early, enabling traders to fine-tune their trading decisions effectively.
Practical Tips for Maximizing ADX
How can traders leverage ADX effectively to maximize trend analysis and decision-making in their trading strategies? To make the most out of the Average Directional Index (ADX), traders can follow these practical tips:
- Combine ADX with +DI and -DI lines: By integrating these components, traders can obtain a comprehensive view of the market trends and potential opportunities.
- Utilize ADX values above 25: Confirming strong trends becomes more effective when ADX values exceed 25, indicating a significant directional movement in the market.
- Implement ADX crossovers with other indicators: Enhance the accuracy of trading signals by incorporating ADX crossovers with complementary indicators for more precise entry and exit points.
- Adjust ADX settings based on time frames: Optimal results are achieved by customizing ADX settings according to the specific time frames being analyzed, allowing for better alignment with the market conditions.
Common Mistakes to Avoid With ADX
When utilizing the Average Directional Index (ADX) in technical analysis, traders must be cautious of common mistakes that could hinder their trend analysis and decision-making process. Misinterpreting ADX values below 25 as weak trends can lead to missed trading opportunities.
Failing to combine ADX with other indicators can result in incomplete trend analysis, overlooking the importance of verifying ADX signals with price action may lead to false trading signals.
Ignoring the context of market conditions when using ADX may result in incorrect trend assessments. Relying solely on ADX values without considering market volatility can lead to inaccurate trend strength evaluations.
Therefore, traders should be attentive to these potential pitfalls to ensure a comprehensive and accurate analysis when utilizing the ADX indicator in assessing market trends and making informed trading decisions.
How Can Utilizing the ADX Technical Analysis Guide Maximize Profits?
Utilizing the ADX technical analysis guide plays a crucial profit maximization role in ADX trading. By identifying strong trends and potential price movements, traders can make informed decisions to maximize profits. The ADX indicator serves as a valuable tool to enhance trading strategies and achieve better results in the market.
Frequently Asked Questions
What Is the Best Way to Use ADX Indicator?
Utilize the ADX indicator effectively by combining it with complementary indicators like RSI or MACD for comprehensive analysis. Employing a 14-period setting enhances trend identification accuracy. ADX readings above 25 signify robust trends conducive to trend-trading strategies.
What Is the Best Time Frame for ADX Indicator?
The ideal time frame for the ADX indicator varies based on trading objectives. Typically, a 14-period ADX setting is preferred for assessing trend strength. However, day traders may opt for a 3-period setting to capture short-term trends, while swing traders adjust based on their time frames.
How Do You Analyse Adx?
Analyzing ADX involves monitoring readings above 25 for strong trends, combining with +DI and -DI lines for trend direction. Values below 25 signal non-trading periods. Watch ADX changes for trend reversals and confirm breakouts for trading decisions.
What Are the Best ADX Settings for a 5 Minute Chart?
For a 5-minute chart, the optimal ADX setting is often 14 periods. This choice aids in capturing swift price changes, enabling traders to spot short-term trends promptly. Adjusting ADX for shorter time frames enhances intraday trend analysis, aiding in decision-making.
Conclusion
Just as a skilled navigator relies on a compass to guide them through rough seas, traders can depend on the ADX indicator to navigate the complexities of the financial markets.
By mastering the 7 essential tips for ADX technical analysis, traders can harness the power of trend strength analysis to steer their trading journey towards success.
Embrace the ADX indicator as your trusted compass, guiding you through the turbulent waters of trading with confidence and precision.