
When observing the stock market, have you ever wondered how volume indicators like Chaikin Money Flow or Accumulation/Distribution can provide valuable insights into market trends and price movements?
Understanding these key volume-based indicators can be the missing piece in your trading strategy puzzle, offering a deeper understanding of market dynamics and potential signals for profitable trades.
By grasping the intricacies of these indicators, you may unlock a new level of precision in your stock trading decisions.
Overview of Volume-Based Indicators
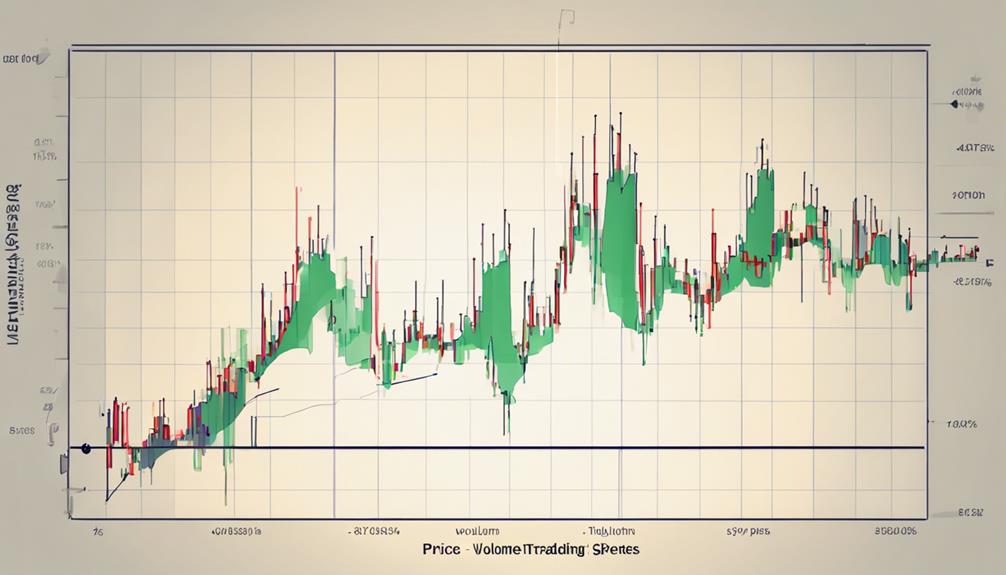
Volume-based indicators in stocks offer valuable insights into market activity by analyzing trading volume. These indicators help you assess the strength of price movements and make informed decisions based on volume data.
By using volume-based indicators like On-Balance Volume (OBV), Money Flow Index, and Accumulation Distribution Indicator, you can confirm trends, spot potential reversals, and understand market sentiment. Incorporating volume-based indicators into your analysis complements price analysis and enhances your trading strategies.
Understanding how volume influences market dynamics is crucial for interpreting price movements accurately and improving the effectiveness of your trading decisions. Volume-based indicators provide a deeper understanding of market trends and can significantly impact the success of your trading approach.
Importance of Volume Analysis
Understanding the significance of volume analysis is crucial for interpreting market dynamics.
It helps to gauge the strength behind price movements and validates the trends observed in stock prices.
Volume Signals Strength
When analyzing stocks, the strength of volume signals plays a crucial role in determining market movements and potential price reversals. High trading volumes in rising markets indicate strength and support upward movement, while increasing volume in falling prices suggests a downtrend and market weakness.
Additionally, new highs or lows on decreasing volume may signal potential reversals in price direction. Utilizing volume indicators such as the On-balance volume (OBV) and Klinger oscillator can help traders gauge market trend strength.
Volume analysis aids in identifying trends, confirming breakouts, and anticipating potential reversals in stock prices. By paying attention to volume signals, investors can gain valuable insights into market dynamics and make more informed trading decisions.
Volume Confirms Price Movements
In analyzing stocks, the confirmation of price movements through volume is pivotal for discerning market strength and potential reversals. Volume acts as a crucial indicator, revealing the underlying force behind price shifts. Here's why volume analysis matters:
- Increasing volume in rising markets indicates bullish strength.
- High volume accompanying falling prices suggests bearish momentum.
- Volume patterns aid in identifying trend reversals and shifts in market direction.
- Key volume-based tools like On-balance volume (OBV) and the Klinger oscillator help confirm price trends effectively.
Understanding these volume dynamics can provide traders with early signals for price movements and empower them to make well-informed decisions.
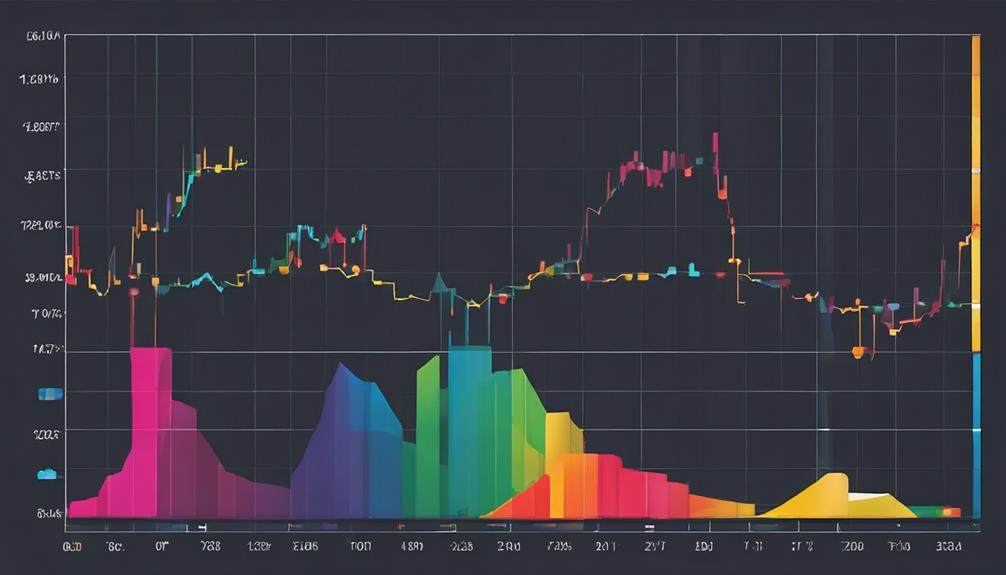
Types of Volume Indicators
Volume indicators in stocks encompass various tools that gauge trading activity and provide insights into market dynamics.
The NVI, Positive Volume Index, Money Flow Index, Accumulation Distribution, Balance of Power, Volume RSI, and on-balance indicator are significant technical volume indicators.
The NVI tracks the strength of price movements based on volume changes.
The Positive Volume Index highlights days with positive volume flow.
The Money Flow Index combines volume and price data to assess money flow strength.
Accumulation Distribution predicts trends by analyzing volume and price relationships.
The Balance of Power determines buyer or seller strength by correlating volume with price movements.
The Volume RSI indicates overbought or oversold conditions using volume data.
The on-balance indicator evaluates buying and selling pressure by comparing volume to price changes.
Interpretation of Volume Patterns
Understanding the interpretation of volume patterns is crucial for traders seeking to make informed decisions in the stock market. When analyzing volume patterns, keep these key points in mind:
- Increasing volume during price breakouts serves as an indicator of strength in the current trend.
- Divergence between price movements and volume patterns can signal potential trend reversals.
- Volume analysis aids in evaluating the liquidity of financial assets and the ease of trading.
- Recognizing volume patterns plays a vital role in enhancing trading strategies and decision-making processes.
Application in Trend Identification
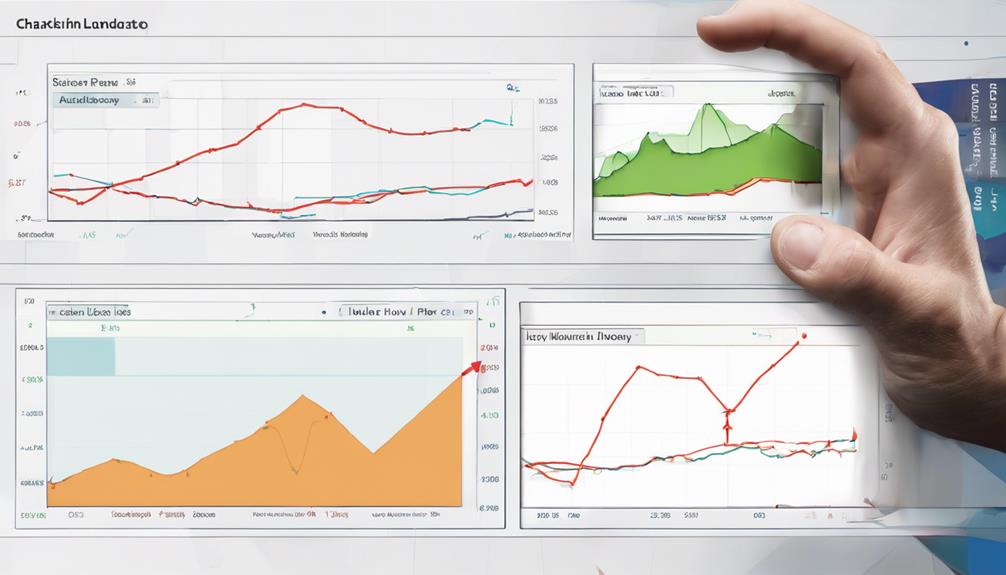
Utilize volume-based indicators to pinpoint and validate trends efficiently for strategic trading decisions.
On-Balance Volume (OBV) tracks the volume-price relationship, while the Chaikin Money Flow indicator assesses buying and selling pressure to gauge trend strength.
The Volume Price Trend Indicator analyzes price direction changes in correlation with volume data.
Additionally, the Money Flow Index combines price and volume analysis to evaluate money flow in a security.
By understanding these volume indicators, you can effectively identify and confirm trends, enabling more informed trading decisions.
Incorporating these tools into your analysis provides valuable insights into the market dynamics, helping you make well-founded decisions based on the interplay between volume and price movements.
Volume-Based Reversal Signals
When analyzing volume spikes in stocks, you can pinpoint potential reversals as they often coincide with shifts in market sentiment.
By confirming these volume-based signals with price action, you gain a clearer picture of possible trend changes.
Watch for decreasing volume during reversals, as it can hint at a lack of conviction in the prevailing trend.
Volume Spikes Indicate Reversals
A surge in trading volume often precedes potential reversals in stock price movements. When volume spikes occur, they can act as early indications of possible price reversals in stocks. Here are some key points to consider regarding volume spikes and their significance in signaling reversals:
- A sudden surge in trading volume can signal a shift in market sentiment.
- High volume spikes suggest increased investor interest and potential trend changes.
- Traders use volume-based reversal signals to anticipate market direction changes.
- Volume spikes provide valuable insights into potential price reversals and help traders make informed decisions.
Understanding the relationship between volume spikes and reversal signals is crucial for navigating the stock market effectively.
Confirmation From Price Action
Volume-based reversal signals in stocks are pivotal for confirming price action before significant trend changes occur. High volume during price reversals can indicate potential trend shifts in the stock market.
Traders rely on volume analysis to identify key reversal points based on volume patterns. Volume-based indicators like OBV and Money Flow Index play a crucial role in validating price movements for trend reversals.
By monitoring volume behavior alongside price action, traders can effectively confirm stock market trends. Understanding how volume interacts with price action is essential for making informed trading decisions and staying ahead of trend changes.
Incorporating volume analysis into your trading strategy can provide valuable insights into confirming trends and anticipating potential market movements.
Watch for Trend Shifts
To effectively gauge potential trend shifts in stocks, closely monitor volume behavior during price reversals for key insights into market sentiment and direction changes. Keep an eye out for the following indicators:
- Increasing volume during price reversals can signal potential trend shifts.
- Volume-based reversal signals provide clues about changes in market sentiment.
- High volume spikes along with price changes often confirm trend shifts.
- Analyzing volume patterns during reversals can offer valuable insights into the strength of the new trend.
Practical Use in Stock Trading
When utilizing volume-based indicators in stock trading, keen observation of volume patterns can provide valuable insights into market dynamics and potential price movements. Volume analysis assists in understanding market sentiment, revealing the behavior of buyers and sellers.
By monitoring volume alongside price trends, traders can confirm the strength behind stock movements and identify potential reversals. Volume indicators like On Balance Volume (OBV) and Chaikin Money Flow (CMF) are essential tools for enhancing trading strategies, aiding in timing entry and exit points effectively.
Incorporating volume indicators in pullbacks is crucial to improving decision-making and predicting price reversals accurately. Understanding volume patterns during price breakouts can significantly impact traders' ability to make informed buying and selling decisions in the market.
What Are the Most Important Volume-Based Indicators to Look for in Stock Trading?
When it comes to stock trading, keeping an eye on essential volume-based indicators stocks is crucial. Look for indicators like on-balance volume, volume-weighted average price, and accumulation/distribution to gauge market sentiment and potential price movements. Paying attention to these indicators can help make more informed trading decisions.
Frequently Asked Questions
What Is a Key Volume Indicator?
A key volume indicator measures trading activity in a specified period, helping you assess market interest and liquidity. Common indicators include OBV, Volume RSI, Money Flow Index, and Accumulation Distribution Indicator, offering insights for making informed trading decisions.
What Is the Volume Based Stock Indicator?
In stock trading, volume-based indicators gauge market activity and liquidity. They reveal buying and selling pressure strength, aiding in trend analysis and decision-making. Examples include On-Balance Volume (OBV) and Volume Price Trend Indicator.
Which Indicator Is Best for Volume?
For volume analysis, consider On-Balance Volume (OBV) as it reflects buying or selling pressure based on volume and price movements. It's a reliable indicator that can provide insights into market dynamics and potential shifts.
How Do You Read a Volume Profile Indicator?
To read a volume profile indicator, analyze the volume traded at different price levels over a specific period. Identify areas of high and low volume concentration to understand market sentiment. Use this data to pinpoint support and resistance levels, aiding in informed trading decisions.
Conclusion
Incorporating volume-based indicators in your trading toolkit is like adding a powerful compass to navigate the unpredictable seas of the stock market. These indicators not only provide crucial insights into market dynamics but also serve as a guiding light to identify trends and potential entry/exit points.
By harnessing the power of volume analysis, you can unlock a treasure trove of information that can significantly enhance your trading success. Dive in and let volume be your guiding star in the world of stocks.