
Understanding the intricate nuances of the ROC indicator is crucial for traders aiming to navigate the complexities of market momentum effectively.
From misinterpreting signals to neglecting divergence indications, common errors can significantly impact trading decisions.
However, by delving deeper into the intricacies of ROC calculations and vigilantly analyzing historical context, traders can avert these pitfalls and optimize their trading strategies.
Exploring the nuances of interpreting ROC values and their implications can offer valuable insights into enhancing decision-making processes and achieving more favorable trading outcomes.
Misinterpreting ROC Indicator Signals
Misinterpreting ROC indicator signals can significantly impact the accuracy of trading decisions, highlighting the importance of a thorough understanding of the indicator's calculation method. The ROC (Rate of Change) indicator is a technical momentum indicator that measures the percentage change in price between the current price and a past price. Traders utilize the ROC to identify potential trends, overbought or oversold conditions, and momentum shifts in the market.
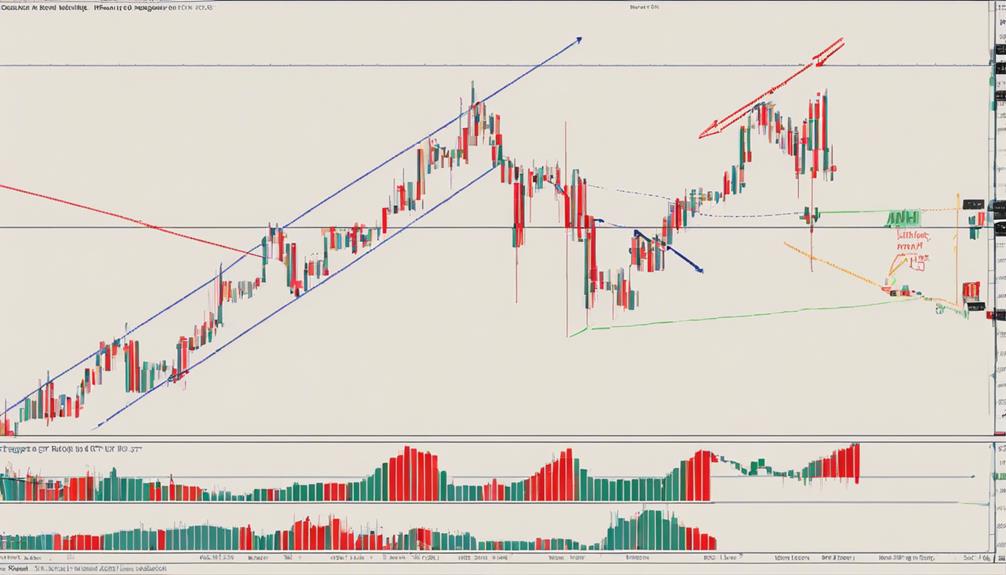
When misinterpreting ROC signals, traders may misjudge the direction of price movements, leading to erroneous trading decisions. For instance, misreading a sudden spike in the ROC as a confirmation of a new trend without considering other indicators could result in entering or exiting trades prematurely. It is crucial to remember that ROC values above zero indicate positive momentum, while values below zero suggest negative momentum. However, traders should exercise caution as isolated ROC spikes or drops may not always indicate a definitive trend change.
To mitigate the risk of misinterpretation, traders can cross-verify ROC signals with other technical indicators to confirm trading decisions accurately.
Overlooking Historical Context

Inadequate consideration of historical context when analyzing the ROC indicator signals can compromise the accuracy and effectiveness of trading decisions. Historical context, derived from past price movements, plays a crucial role in interpreting the momentum indicated by ROC.
By overlooking historical data, traders may miss essential patterns and trends that can significantly impact future price action. Misinterpreting ROC signals due to the absence of historical context can result in trading errors and flawed decision-making processes.
Therefore, it is imperative to analyze historical data alongside ROC readings to enhance trading accuracy. Incorporating historical context not only helps in understanding the current market dynamics better but also aids in making more informed decisions based on a comprehensive view of the security's performance over time.
Traders must recognize the importance of historical context in avoiding misinterpretation of ROC signals and ensuring more robust trading strategies.
Failing to Confirm With Price Action
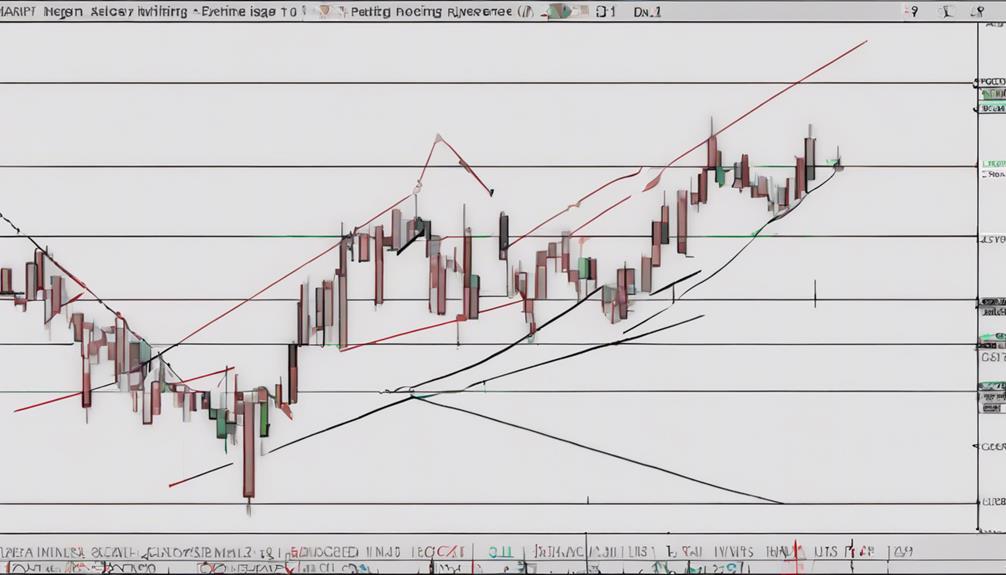
Failure to align ROC Indicator signals with price action can undermine the reliability of momentum assessments and potential price projections in trading scenarios. Traders need to ensure that the signals generated by the ROC Indicator are supported by corresponding movements in price action to make informed trade decisions.
Here are three crucial points to consider when confirming ROC Indicator signals with price action:
- Validation of Momentum Shifts: Price action confirmation helps validate the momentum shifts indicated by the ROC Indicator, providing traders with more confidence in the reliability of the signals.
- Enhanced Accuracy of Price Changes: By aligning ROC Indicator readings with price action movements, traders can better anticipate potential price changes and adjust their strategies accordingly.
- Avoiding False Signals: Price action confirmation is essential for filtering out false signals generated by the ROC Indicator, enabling traders to focus on valid trading opportunities and avoid costly mistakes.
Neglecting Divergence Signals
Neglecting divergence signals in the ROC indicator can significantly impact traders' abilities to anticipate and capitalize on potential trend reversals.
Divergence signals occur when there is a discrepancy between price movements and the momentum indicated by the Rate of Change (ROC) indicator. Bullish divergence manifests when the price creates lower lows while the ROC indicator forms higher lows, suggesting a potential uptrend. Conversely, bearish divergence emerges when the price achieves higher highs while the ROC indicator displays lower highs, indicating a probable downtrend.
Recognizing these signals enables traders to foresee potential trend changes and facilitates making informed trading decisions. Failure to acknowledge these crucial signals may result in missed opportunities to identify potential trend reversals promptly. Consequently, traders risk overlooking adjusting their trading strategies accordingly to align with potential trend changes.
Misjudging Volatility Impact
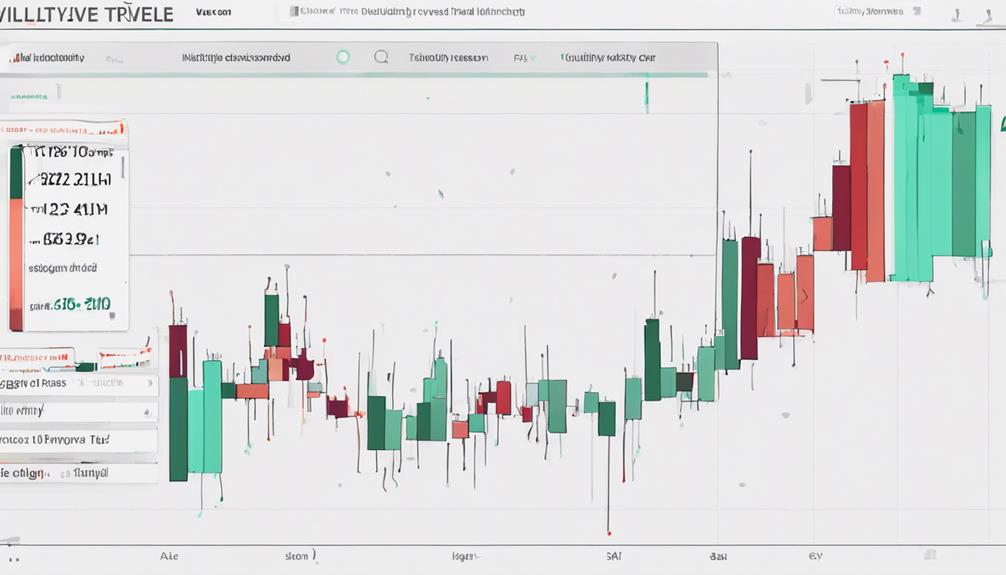
Volatility plays a crucial role in influencing the accuracy of signals generated by the ROC indicator in response to market price movements. When misjudging volatility impact, traders may encounter false signals due to exaggerated price changes.
To navigate this challenge effectively, understanding volatility is key. Traders can filter out noise by focusing on valid ROC signals that are not solely driven by exaggerated price movements. Additionally, adjusting the parameters of the ROC indicator based on the level of volatility in the market can enhance its effectiveness in capturing meaningful price changes.
How Can I Use the ROC Indicator to Avoid Common Errors and Improve Optimization?
When using the ROC indicator, it’s essential to implement the best ROC indicator optimization methods to avoid common errors and improve accuracy. By carefully analyzing the rate of change in stock prices and employing effective strategies, you can optimize your trading decisions and achieve better results.
Frequently Asked Questions
Is ROC a Good Indicator?
The Rate of Change (ROC) indicator is a valuable tool for traders, offering insights into price momentum and potential reversals. Its ability to confirm trends and optimize trade timing makes ROC a good indicator for decision-making in financial markets.
What Is the ROC Indicator Strategy?
The ROC indicator strategy measures price change velocity within a specified period, aiding in momentum analysis for identifying potential market shifts. Integrating ROC into trading systems provides valuable buy/sell signals, enhancing decision-making and trade timing accuracy.
Which Is Better RSI or Roc?
In comparing RSI and ROC, the choice depends on your objectives. RSI identifies trend reversals through overbought/oversold levels, while ROC focuses solely on price momentum. Consider your trading style and goals to determine whether you prioritize trend signals or pure momentum insights.
Is ROC a Leading or Lagging Indicator?
The Rate of Change (ROC) indicator is a leading indicator, offering insights into potential shifts in price momentum before they occur. By measuring the rate of price change, ROC aids traders in proactive decision-making, enhancing trading strategies through early trend identification.
Conclusion
In conclusion, mastering the ROC indicator requires meticulous attention to detail and a deep understanding of its calculations and interpretations. By avoiding common errors such as misinterpretation, overlooking historical context, failure to confirm with price action, neglecting divergence signals, and misjudging volatility impact, traders can make informed decisions and enhance their trading strategies.
Remember, in the world of trading, patience is a virtue that can lead to long-term success.