
Have you ever wondered why the Ichimoku Cloud indicator is highly regarded by traders worldwide? Its reputation is built on the solid foundation of three key basics that can significantly enhance your trading strategies.
By understanding these fundamentals, you can unlock the full potential of this powerful tool and take your trading to the next level.
Explore the intricacies of the Ichimoku Cloud and discover how it can revolutionize your approach to the markets.
Key Components of Ichimoku Cloud
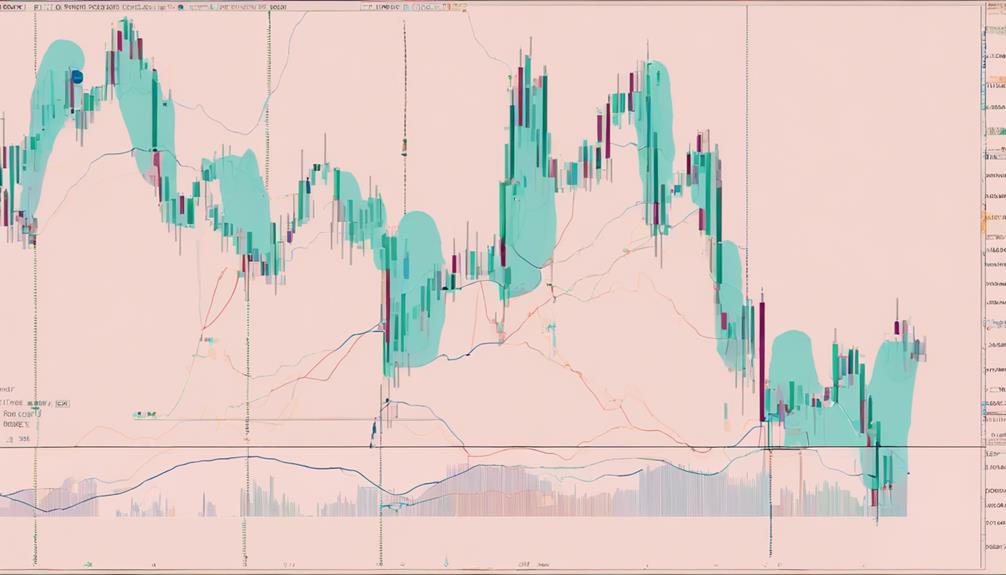
The Ichimoku Cloud indicator comprises essential components that play a crucial role in analyzing market trends and potential price movements.
The Conversion Line is determined by averaging the highest high and lowest low over the past 9 periods, providing a dynamic view of short-term price momentum.
In contrast, the Base Line offers insight into medium-term trends by averaging the highest high and lowest low over the past 26 periods.
Leading Span A is calculated by plotting the average of the Conversion Line and the Base Line 26 periods into the future, serving as a forward-looking indicator.
Leading Span B, on the other hand, represents the average of the highest high and lowest low over the past 52 periods, also plotted 26 periods ahead, adding further depth to trend analysis.
Understanding Ichimoku Cloud Signals
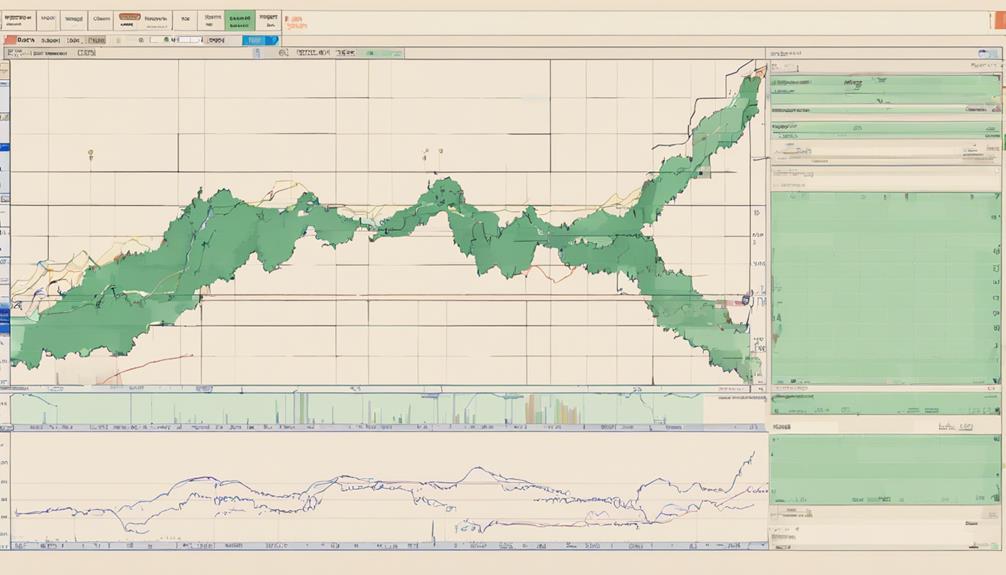
To grasp the implications of the Ichimoku Cloud signals effectively, consider the alignment of price in relation to the Conversion and Base lines for insights into market momentum. When price is above both lines, it signals bullish momentum, with the Conversion line crossing above the Base line confirming rising momentum.
Price residing above the Cloud indicates an uptrend, while price below suggests a downtrend. The Cloud serves as both support and resistance, offering essential information on trend direction and momentum. By combining Ichimoku with indicators like RSI, you can enhance your ability to identify potential reversals and strengthen trade signals.
Understanding these dynamics can assist you in making more informed trading decisions based on price action and trend analysis.
Practical Application of Ichimoku Cloud
Utilizing the Ichimoku Cloud in your trading strategy can provide valuable insights into market dynamics, aiding in more informed decision-making and enhanced analysis of price movements.
The Ichimoku Cloud indicator helps identify key support and resistance levels, offering clear trading signals for decision-making. By forecasting future support or resistance levels, traders can enhance their technical analysis and better understand trend direction and momentum.
It's crucial to validate Ichimoku Cloud signals with other technical analysis tools to improve risk-adjusted returns and confirm trades. Widely used across various markets like stocks, cryptocurrency, and forex, the Ichimoku Cloud's practical application proves to be versatile and effective for traders seeking to optimize their trading strategies.
Can I Learn the Basics of Ichimoku Cloud Indicator Easily?
If you’re new to trading, understanding Ichimoku cloud basics may seem daunting at first. However, with the right resources and dedication, it is possible to grasp the fundamentals of this powerful technical indicator. By studying the various components and practicing its application, you can learn to interpret the Ichimoku cloud with ease.
Frequently Asked Questions
What Is the Best Indicator for the Ichimoku Cloud?
For the Ichimoku Cloud, the best indicator is the Tenkan and Kijun Sen lines. When Tenkan crosses above Kijun, signaling an upward trend and both are above the Cloud, it indicates a positive market direction.
How to Interpret Ichimoku Cloud?
To interpret the Ichimoku Cloud effectively, observe price relative to the Cloud for trend signals. Price above signals uptrend, below indicates downtrend. Watch for Tenkan-sen and Kijun-sen crossovers for entry/exit points. Analyze span lines for support/resistance.
What Is the Basic Ichimoku Strategy?
In the basic Ichimoku strategy, you watch for the Tenkan Sen crossing above the Kijun Sen to signal an uptrend. Confirm a positive trend when both lines are above the Cloud. Understanding these components guides your trading decisions effectively.
What Are the Best Settings for Ichimoku Cloud?
For the best settings on Ichimoku Cloud, stick with the default values of 9, 26, 52. These numbers give a solid view of market dynamics. Adjusting settings might change responsiveness and accuracy, so be mindful.
Conclusion
In conclusion, the Ichimoku Cloud indicator is like a weather forecast for traders, providing a clear view of market conditions and potential trends.
By understanding its key components and signals, you can navigate the financial markets with more confidence and precision.
Just like a skilled navigator uses a compass to guide their journey, the Ichimoku Cloud can be your trusted tool in the world of trading.
So, embrace its power and let it lead you to successful trades.