
As a trader, imagine identifying a potential trend reversal before it happens, allowing you to capitalize on market movements swiftly. Understanding the nuances of trend following indicators can be the key to achieving such precision in your trading decisions.
By delving into the intricacies of each indicator, you can equip yourself with a versatile toolkit to navigate the dynamic landscape of financial markets. This guide offers a structured approach to mastering essential indicators, providing insights that can elevate your trading strategies to a new level of sophistication and effectiveness.
Moving Averages Overview
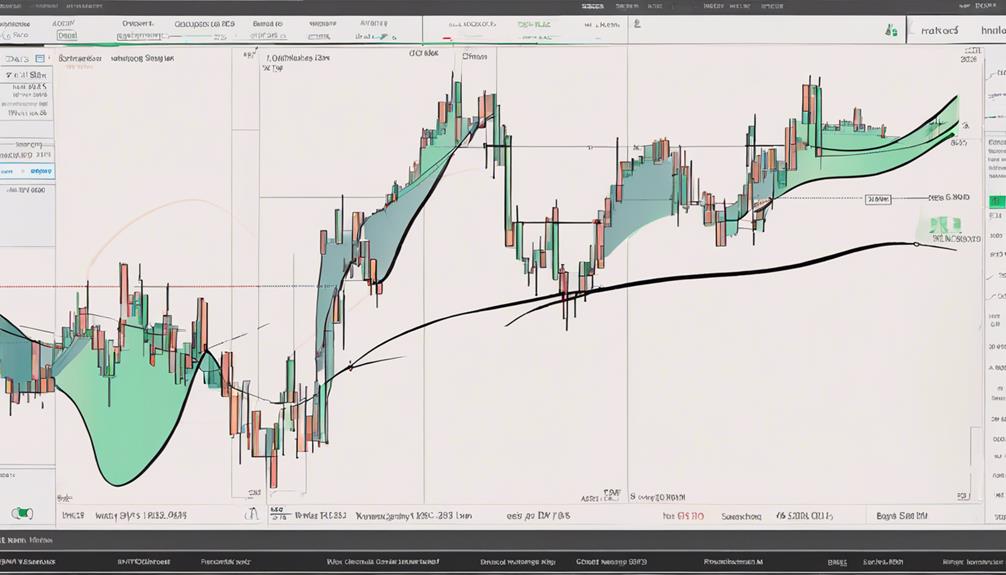
Utilize moving averages as fundamental tools for assessing market trends and identifying potential trade opportunities. Moving averages provide a clear indication of trend direction by smoothing out price data over a specified period. They offer valuable insights into the market's momentum and can help traders make informed decisions.
The golden cross strategy, a popular technique, involves using two moving averages to identify potential trend reversals, signaling a shift in market sentiment. Different types of moving averages, such as simple, exponential, and volume-weighted, each have unique strengths and applications. These classic indicators have enduring relevance due to their effectiveness in trend analysis, making them essential for traders looking to capitalize on potential trading opportunities based on market trends.
Understanding MACD Indicator
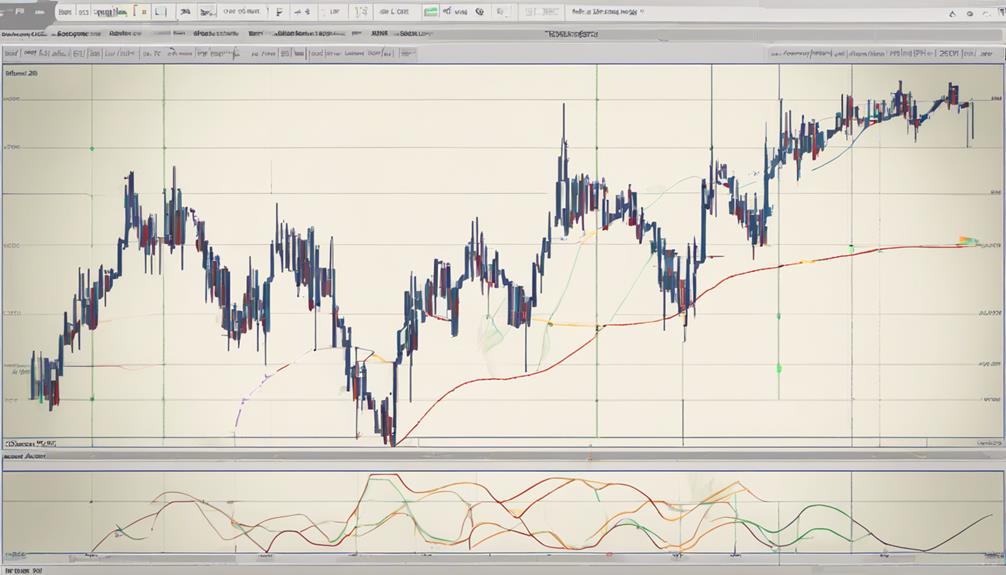
Moving on from exploring Moving Averages, delve into the intricate workings of the MACD Indicator, a powerful tool that combines exponential moving averages to capture and analyze market momentum effectively.
The MACD indicator includes components like the MACD line, signal line, histogram, and zero line, all crucial for trend analysis. A bullish market signal is evident when the MACD line is above zero, indicating positive momentum. Utilizing the signal line aids in spotting potential trend reversals within the market.
Traders frequently employ the MACD indicator alongside other analytical tools to enhance their trend analysis capabilities. Understanding the nuances of the MACD indicator and its various elements can provide valuable insights into market dynamics and potential trading opportunities.
Exploring On Balance Volume (OBV)
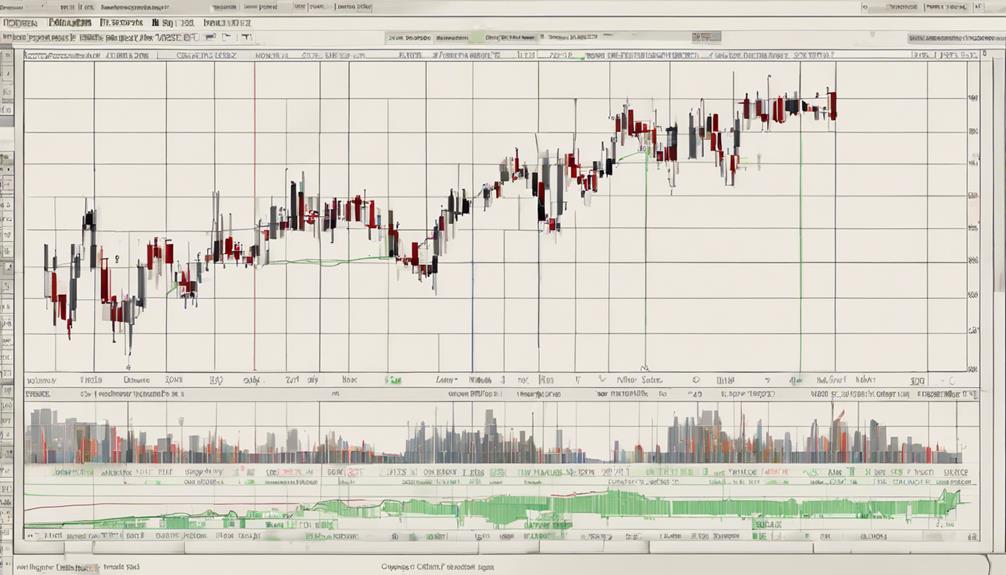
On Balance Volume (OBV) serves as a crucial momentum indicator in the realm of technical analysis, utilizing volume to depict the flow of volume within a security. It calculates OBV by cumulating volume based on price changes, offering insights into buying and selling pressure.
An increasing OBV line indicates a strong uptrend, signaling bullish control in the market. Conversely, a decreasing OBV line suggests bearish dominance and a potential downtrend. Traders find OBV valuable for confirming trends and making informed trading choices grounded in volume dynamics.
Insights on Relative Strength Index (RSI)
When analyzing the Relative Strength Index (RSI), you'll focus on its calculation basics and interpreting RSI signals.
Understanding how RSI values range from 0 to 100 and the implications of overbought and oversold conditions is essential for effective decision-making.
Keep an eye out for divergences between RSI and price movements, as they can offer valuable insights into potential trend reversals.
RSI Calculation Basics
The Relative Strength Index (RSI) calculates the average of up and down price changes over a specified period, typically 14 days, providing valuable insights into market conditions. RSI values range from 0 to 100, with readings above 70 indicating overbought conditions and below 30 suggesting oversold conditions.
Traders use RSI to gauge the momentum of price movements and identify potential trend reversals. By analyzing RSI divergence from price action, traders can anticipate shifts in market sentiment. RSI is a popular tool for confirming price trends, determining optimal entry and exit points, and managing risk effectively.
Understanding RSI calculation basics is fundamental for traders seeking to navigate market dynamics and make informed trading decisions.
Interpreting RSI Signals
Interpreting Relative Strength Index (RSI) signals involves analyzing price momentum and speed changes to assess market conditions effectively. RSI, a key momentum indicator, provides insights into overbought and oversold conditions with readings above 70 indicating overbought levels and below 30 suggesting oversold levels.
Divergence between RSI and price action can indicate potential trend reversals, offering traders valuable signals for decision-making. Widely utilized in various trading strategies, RSI aids in evaluating the strength and sustainability of trends. By monitoring RSI levels and their relationship with price movements, traders can better anticipate shifts in market sentiment and potential opportunities for profitable trades.
Incorporating RSI into your analytical toolkit can enhance your ability to navigate dynamic market environments with greater precision.
Decoding Donchian Channel Strategy
You'll explore the fundamentals of the Donchian Channel, understand how to pinpoint entry opportunities, and master the art of risk management within this strategy.
By grasping the basics, identifying optimal entry points, and effectively managing risk, you can enhance your trend-following skills.
Implementing the Donchian Channel strategy with precision can potentially lead to capturing significant market trends and optimizing your trading outcomes.
Donchian Channel Basics
Decoding the Donchian Channel strategy reveals a technical indicator designed by Richard Donchian in the 20th century. This indicator includes upper and lower bands derived from historical price action, typically spanning 20 bars.
The Donchian Channel assists in identifying market trends and offers a structured approach to trading. Traders often utilize breakouts above the upper band or below the lower band as potential entry points. By focusing on these entry signals, traders aim to capitalize on emerging market movements.
To enhance the effectiveness of the Donchian Channel strategy, traders commonly incorporate additional filters or confirmation signals to refine their trading decisions and reduce false signals, ultimately improving their overall trading performance.
Setting Entry Points
To effectively implement the Donchian Channel strategy for setting entry points, traders rely on the breakout signals above or below the upper and lower bands based on 20-bar highs and lows. These breakout points serve as crucial entry signals for initiating trades in line with the prevailing trend.
By utilizing the Donchian Channel strategy, traders can capitalize on market movements and enhance their trend-following effectiveness. However, it's essential to remember that this strategy is more effective when combined with additional filters to minimize false signals and improve overall performance.
Richard Donchian's creation of the Donchian Channel aimed to provide a systematic approach to identifying trends and determining optimal entry points based on market dynamics. Embracing this strategy can lead to informed decision-making and better trading outcomes.
Managing Risk Effectively
Managing risk effectively in trend following strategies like the Donchian Channel involves precise identification of key support and resistance levels based on 20-bar highs and lows. When decoding the Donchian Channel Strategy for risk management, consider the following:
- Utilize breakout signals above the upper band or below the lower band for potential entry points.
- Implement filters to confirm trend direction and reduce false signals.
- Set stop-loss orders using Donchian Channels to control risk.
- Determine optimal risk management levels by analyzing the channel's dynamics.
Parabolic SAR Essentials
When utilizing Parabolic SAR, traders can effectively pinpoint potential trend reversals in asset prices by observing the placement of dots above or below the price chart. This trend-following indicator is valuable for indicating the direction of trends and assisting traders in setting trailing stops to manage risk efficiently.
The dots of the Parabolic SAR switch positions when a trend reversal occurs, providing clear signals to traders. By incorporating the Parabolic SAR indicator into their analysis alongside other tools, traders can make well-informed decisions regarding market trends and potential entry or exit points.
Understanding the essentials of the Parabolic SAR can enhance a trader's ability to navigate the dynamic landscape of asset price movements with greater precision and confidence.
Aroon Indicator Breakdown
When examining the Aroon Indicator breakdown, you'll explore the intricacies of its calculation and the significance of interpreting Aroon signals.
Understanding how Aroon up and Aroon down interact can offer valuable insights into potential market shifts and trend strength.
Aroon Calculation Explanation
In the realm of trend following indicators, the Aroon Calculation serves as a pivotal tool for evaluating trend strength through analyzing the time elapsed since price highs and lows.
- Aroon Indicator calculates Aroon Up and Aroon Down lines based on time since highs and lows.
- Aroon Up measures time since the highest price, while Aroon Down measures time since the lowest price.
- The indicator's values range from 0 to 100, with over 70 indicating a strong uptrend and below 30 signaling a strong downtrend.
- Traders utilize the Aroon Indicator to pinpoint potential trend changes and effectively navigate strong trending markets.
The Aroon Indicator is a reliable instrument for assessing trend direction and strength, offering valuable insights for making strategic trading decisions.
Interpreting Aroon Signals
The analysis of Aroon signals within the Aroon Indicator breakdown provides traders with crucial insights into trend direction and potential market movements based on the relationship between Aroon up and Aroon down lines.
When the Aroon up line crosses above the Aroon down line, it suggests a potential uptrend, indicating a bullish market sentiment. Conversely, if the Aroon down line crosses above the Aroon up line, it implies a possible downtrend, signaling a bearish outlook.
Aroon values ranging from 0 to 100 help traders determine the strength of the trend, with higher values indicating a more robust trend direction. By interpreting Aroon signals accurately, traders can effectively capture trending markets and anticipate potential trend reversals, enhancing their decision-making process.
Mastering ADX Indicator
To truly master the ADX Indicator, delve into its numerical values and interpret their implications for trend strength. Understanding this indicator can significantly enhance your trend-following strategies by providing objective measurements.
Here's a breakdown to help you navigate the ADX effectively:
- Numerical Scale: ADX ranges from 0 to 100, with values above 25 indicating a strong trend.
- Confirmation Tool: Often used alongside other indicators to confirm trend direction and filter out false signals.
- Trend Assessment: A rising ADX signifies a strengthening trend, while a falling ADX indicates a weakening trend.
- Versatility: ADX's applicability across various financial markets makes it a valuable tool for traders seeking to gauge trend quality.
Bollinger Bands Unveiled
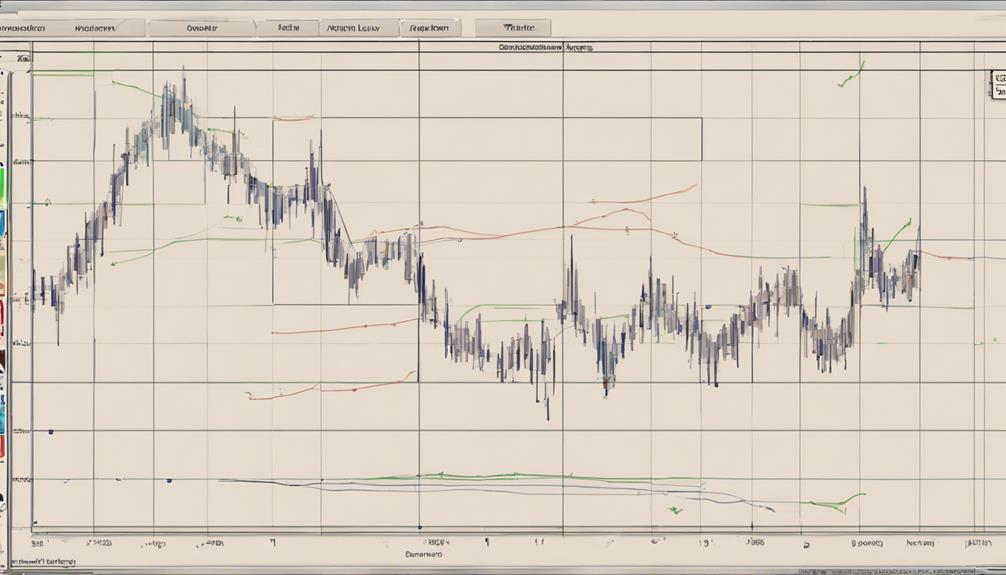
Unveil the essence of Bollinger Bands – volatility indicators comprising upper, lower, and middle bands based on standard deviations from a moving average. These bands offer traders insights into market dynamics by indicating potential price levels. When the price touches the upper band, it may signal overbought conditions, suggesting a potential reversal or pullback.
Conversely, touching the lower band may indicate oversold conditions, presenting a buying opportunity. Widening bands reflect increased market volatility, while narrowing bands suggest decreased volatility. Bollinger Bands are valuable tools for traders to gauge market conditions, capture price extremes, and identify potential trend reversals.
Their adaptability to various market environments and simplicity in visually representing price movements make them a popular choice among traders.
Best Practices for Trend Indicators
Consider combining multiple trend indicators to enhance signal confirmation and improve the accuracy of trend analysis. When utilizing trend indicators in your trading strategies, follow these best practices:
- Adjust Settings: Modify indicator settings based on market conditions to optimize performance and adapt to changing trends.
- Combine with Price Action: Use trend indicators alongside price action analysis for a comprehensive market assessment.
- Regular Review: Continuously review and analyze the effectiveness of trend indicators to fine-tune your trading strategies.
- Historical Performance: Consider the historical performance and reliability of trend indicators when selecting the most suitable ones for effective trend following.
What Makes These Trend Following Indicators the Best Choices for Traders?
When it comes to finding the best trend following indicators complete for traders, there are a few key features to look for. These indicators should be reliable, easy to use, and able to adapt to changing market conditions. By incorporating these indicators into their strategy, traders can make more informed decisions and improve their overall performance.
Frequently Asked Questions
What Are the Best Trend Indicators?
To identify trends effectively, consider using popular indicators like Simple Moving Average (SMA), Exponential Moving Average (EMA), MACD, Bollinger Bands, RSI, and Parabolic SAR. These indicators assess market momentum, overbought/oversold conditions, strength of price movements, and trend directions.
What Is the Best Trend-Following Strategy?
To excel in trend-following, identify and ride market trends using indicators. Utilize moving averages, MACD, and Bollinger Bands for precision. Embrace momentum and incorporate breakout strategies to enhance success. Stay focused on capturing profitable trends.
Which Trading Indicator Is Most Accurate?
For the most accurate trading indicator, consider the Moving Average Convergence Divergence (MACD). It excels at capturing momentum and spotting potential trend shifts. Reliable and widely used, it provides valuable insights for navigating market trends effectively.
How Do You Identify a Trend With an Indicator?
To identify a trend with an indicator, look for consistent patterns of higher highs and higher lows in an uptrend or lower highs and lower lows in a downtrend. Use moving averages, crossovers, and trendlines to confirm trends effectively.
Conclusion
In conclusion, mastering the art of trend following indicators is crucial for successful trading. By incorporating a combination of Moving Averages, MACD, RSI, and other key indicators, you can stay ahead of market trends and make informed decisions.
Remember, the early bird catches the worm when it comes to identifying and capitalizing on profitable trends. So, keep sharpening your skills and honing your strategies to maximize your trading potential.