
Imagine the Advance Decline Line as a compass guiding you through the market's intricate maze. Understanding its significance can be the key to unlocking hidden patterns and trends that may impact your trading decisions.
As you navigate the complexities of trading, delving deeper into the world of the Advance Decline Line could be the missing piece to enhancing your strategies and gaining a competitive edge in the market.
Importance of Advance Decline Line
In assessing market breadth, the Advance Decline Line (A/D Line) plays a pivotal role as an essential indicator for traders. By monitoring the daily difference between advancing and declining stocks, the A/D Line offers valuable insights into market sentiment and overall direction.
Through the cumulative sum of these differences, traders can gauge the strength of market participation. A rising A/D Line signifies broad market strength and active participation in rallies, while a declining A/D Line indicates weakening market breadth. Moreover, spotting any divergence between the A/D Line and the index can signal a potential trend reversal, enabling traders to confirm price trends accurately.
Ultimately, the A/D Line serves as a leading indicator, empowering traders to make informed decisions based on market breadth and performance.
Calculating the AD Line
To calculate the AD Line effectively, subtract the number of declining issues from advancing issues on stock exchanges. The AD Line is a cumulative measure of market breadth, helping traders determine market strength or weakness.
Here are some key points to consider:
- The AD Line is a technical indicator used to track the net advances in the market.
- It reflects the number of advancing stocks versus declining issues.
- Understanding the AD Line is crucial for interpreting market trends.
- Traders look at whether the AD Line is rising or falling to gauge market participation.
- By calculating the Net Advances, traders can make informed decisions based on the AD Line's insights.
Analyzing Divergence in AD Line
Analyzing Divergence in the AD Line reveals crucial insights into potential market trends and sentiment shifts. When the Advance-Decline (A/D) Line moves counter to the market index, it signifies divergence.
Bullish divergence in the A/D Line points to underlying strength during price declines, while bearish divergence suggests weakness amidst price increases. Traders keen on confirming market movements and anticipating trend changes utilize these divergences.
Utilizing AD Line for Trading
Utilize the AD Line effectively to enhance trading strategies and gain valuable insights into market dynamics and potential trend shifts. The AD Line is a crucial tool in technical stock market analysis, offering the following benefits:
- Confirm Price Trends: Use the AD Line to confirm the direction of price trends in the market.
- Assess Market Breadth: Gauge market participation strength by tracking the net difference between advancing and declining stocks.
- Identify False Signals: Monitor the AD Line to spot false market signals and potential divergence with price movements.
- Time Trade Entries: Utilize the AD Line to time trade entries based on the strength of market participation.
- Enhance Analysis: Combine the AD Line with other technical indicators to make well-informed trading decisions.
What Role Does the Advance Decline Line Play in Trading?
The advance decline line importance in trading cannot be overlooked. This indicator helps traders gauge the overall breadth of the market by tracking the number of advancing and declining stocks. It provides valuable insights into the strength or weakness of the market trend, making it a crucial tool for traders.
What Is the Significance of the Advance Decline Line in Trading?
The advance decline line essential in trading measures the number of advancing and declining stocks. It provides valuable insights into market strength and can indicate potential changes in trends. By analyzing this indicator, traders can make more informed decisions about market direction and potential opportunities for profitable trades.
Interpreting AD Line Trends
If you want to understand market trends effectively, interpreting AD Line trends is crucial for gaining valuable insights into market dynamics and potential trend shifts.
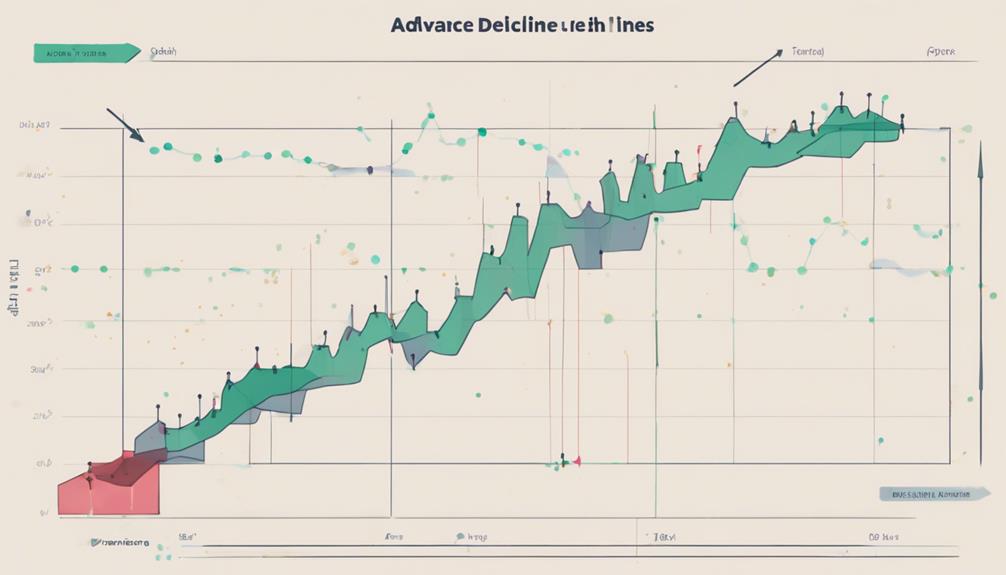
The Advance Decline (A/D) line acts as a breadth indicator, reflecting the number of advancing and declining stocks in the market. A rising A/D line indicates strong market participation and broad stock strength, suggesting a robust market direction with widespread optimism among investors.
Conversely, a falling A/D line signals weakening market breadth, potentially hinting at the end of a rally. Divergence between the A/D line and stock index movements can offer early signals of a possible trend reversal.
Traders often use the A/D line as a leading indicator in technical analysis, as it can precede price movements and provide valuable insights for decision-making.
Frequently Asked Questions
Why Is the Advance-Decline Line Useful?
In trading, the Advance-Decline Line is useful for gauging market breadth, confirming trends, and spotting reversals. It tracks advancing and declining stocks equally, reflecting sentiment. Rising lines show strength, falling lines indicate weakness. Watch for divergences for insights.
What Is the Use of Advance Decline Ratio?
You gauge market strength with the Advance Decline Ratio. A ratio above 1 signifies bullish trends, below 1 signals bearish sentiment. Assess market breadth and potential reversals. Valuable for insights into overall market sentiment and direction.
What Is the Advance to Decline Indicator?
The Advance to Decline (A/D) indicator measures the daily gap between advancing and declining stocks. It's a cumulative tool reflecting market sentiment and participation. Subtract declining stocks from advancing ones for net advances, aiding trend analysis.
What Is the Advance Decline Strategy?
In trading, the Advance Decline Strategy involves monitoring daily advances and declines in an index to assess market breadth. It helps you confirm trends, spot reversals, and make informed choices. The Advance Decline Line acts as a leading indicator, guiding your trading decisions.
Conclusion
In conclusion, understanding the Advance Decline Line is essential for traders to assess market breadth and sentiment. By analyzing the AD Line trends, investors can make informed decisions and identify potential risks.
Remember, as the saying goes, 'Don't put all your eggs in one basket.' Diversifying your investments and paying attention to the AD Line can help navigate the complexities of the market and improve trading outcomes.