
In the realm of commodity trading, the application of Elliott Wave Theory offers a structured approach to analyzing market trends and making informed decisions.
Understanding the intricate balance between wave categorization, Fibonacci ratios, and various wave patterns can significantly enhance a trader's ability to navigate the complexities of the market.
By incorporating a strategic blend of technical indicators and risk management strategies, traders can position themselves advantageously in the ever-changing commodity landscape.
Stay tuned to uncover the seven best tips that can elevate your commodity trading endeavors with Elliott Wave Theory.
Fibonacci Ratios Application
Applying Fibonacci ratios within the framework of Elliott Wave Theory is a fundamental aspect essential for precise wave analysis and strategic decision-making in commodity trading. These ratios, including 0.618, 1.618, 0.382, and 1.382, play a pivotal role in measuring wave length and duration, aiding traders in determining targets, retracements, entry points, and exit points. By waiting for significant retracement levels like 50% and placing stops below the 61.8% retracement, traders can effectively manage risk in commodity markets.
Derived from a mathematical sequence present in nature and art, Fibonacci ratios enhance the precision of commodity trading analysis. By integrating these ratios into Elliott Wave Theory, traders can predict market movements more accurately, enabling them to optimize trading decisions. Understanding the significance of Fibonacci ratios in the context of Elliott Wave Theory is crucial for traders seeking to navigate the complexities of commodity trading successfully.
Wave Patterns Recognition
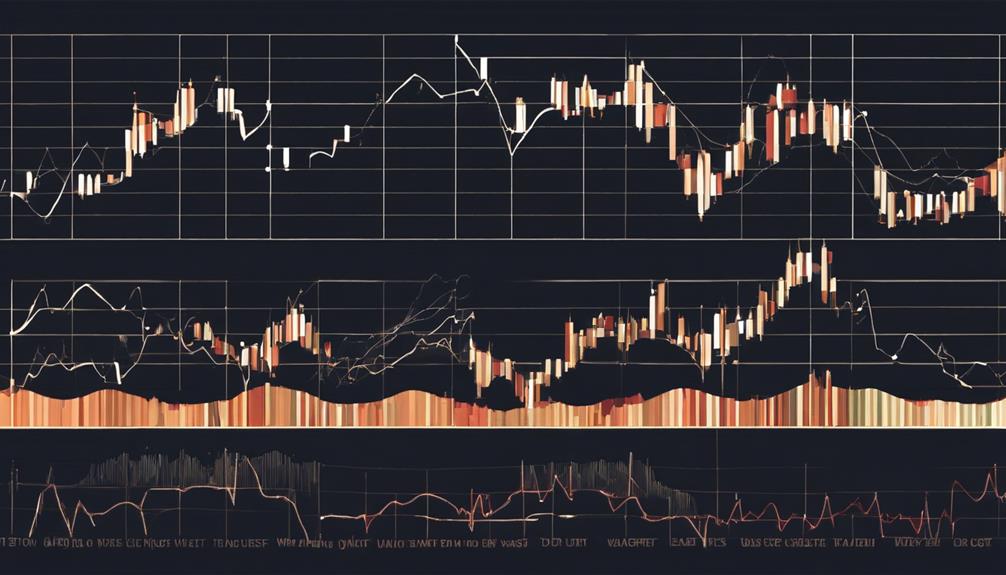
Understanding wave patterns recognition is a crucial skill for traders seeking to forecast market movements accurately in commodity trading. Elliott Wave Trading relies heavily on identifying specific wave patterns to make informed predictions about future price movements.
Here are key points to consider:
- Impulse Waves: Comprising 5 sub-waves that move in the direction of the trend.
- Corrective Waves: Consisting of 3 sub-waves that act against the primary trend.
- Diagonal Waves: These waves exhibit overlapping sub-waves with both extensions and corrections.
- Triangles: Formed by 5 corrective waves, triangles can indicate potential breakouts or breakdowns.
- Market Movements Prediction: Recognizing these patterns is essential for predicting market movements accurately, enabling traders to make informed decisions based on the Elliott Wave Theory.
Indicators Integration
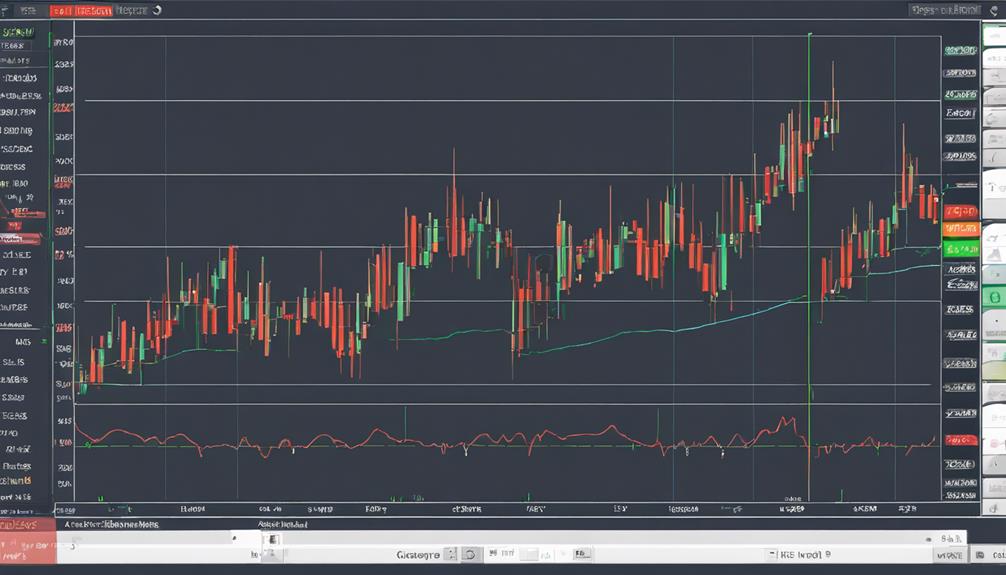
Integrating technical indicators with Elliott Wave Theory allows traders to interpret signals more effectively and recognize chart patterns with greater precision.
By combining wave analysis with various indicators, traders can gain a comprehensive understanding of market trends and potential price movements.
This integration of indicators offers a strategic advantage in decision-making processes for commodity trading strategies.
Signal Interpretation Techniques
Enhancing the accuracy of trading signals in commodity markets can be achieved by integrating Elliott Wave Theory with various technical indicators. When interpreting signals, traders can benefit from the following techniques:
- Using indicators like RSI and MACD for signal confirmation.
- Employing moving averages to validate Elliott Wave patterns.
- Leveraging volume indicators such as OBV and A/D Line to confirm wave analysis.
- Combining trend indicators like ADX and Ichimoku cloud with Elliott Wave Theory for improved signal interpretation.
- Utilizing momentum oscillators like stochastic oscillator and MACD to make better decisions based on Elliott Wave signals.
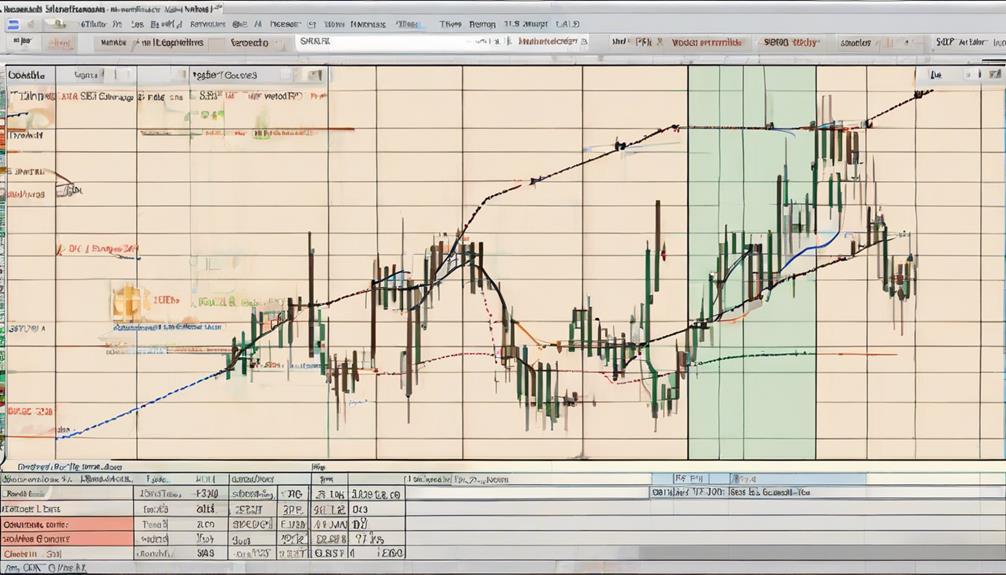
Chart Pattern Recognition
To effectively analyze commodity markets using Elliott Wave Theory, integrating chart pattern recognition with technical indicators is crucial for identifying optimal trading opportunities. Chart pattern recognition, when combined with tools like moving averages, RSI, and Fibonacci ratios, enhances the understanding of wave patterns.
This integration helps traders pinpoint potential entry and exit points accurately, leading to more informed trading decisions. By recognizing chart patterns, traders can confirm Elliott wave counts, strengthening the foundation of their trading strategies.
The synergy between Elliott Wave Theory, chart pattern recognition, and technical indicators provides a comprehensive approach to market analysis, empowering traders to navigate the complexities of commodity trading with greater precision and confidence.
Market Complexities Considerations

Navigating the complexities of commodity markets demands a keen awareness of various factors such as market volatility triggers, risk management techniques, and the application of Elliott Wave Theory. Market participants must grasp the intricate interplay between supply-demand dynamics, geopolitical shifts, and economic indicators to make informed trading decisions.
Utilizing historical data, monitoring global trends, and employing effective risk mitigation strategies are paramount in successfully navigating the multifaceted landscape of commodity trading.
Market Volatility Factors
Market volatility factors play a significant role in commodity trading, encompassing a range of influences from geopolitical events to supply chain disruptions. When considering commodity trading with Elliott waves, traders must be mindful of various market complexities to make informed decisions.
Key factors impacting market volatility in commodity trading include:
- Geopolitical events
- Economic data releases
- Weather patterns affecting agriculture commodities
- Global supply chain disruptions
- Production levels and inventory data
Understanding these factors helps traders anticipate price movements and identify trading opportunities. By incorporating Elliott Wave Theory with a deep understanding of market complexities, traders can effectively navigate the volatility in commodity markets and capitalize on potential opportunities while managing risks efficiently.
Risk Management Strategies
Considering the market complexities inherent in commodity trading with Elliott Wave Theory, prudent risk management strategies are essential for safeguarding capital and optimizing trading outcomes.
Implementing stop-loss orders is crucial to limit potential losses and protect capital. Careful consideration of position sizing and leverage helps manage risk exposure and avoid significant financial setbacks. Diversifying the commodity portfolio is key to spreading risk and reducing the impact of adverse price movements.
Monitoring market volatility and adjusting trading strategies accordingly is necessary to adapt to changing conditions. Staying informed about global economic events and commodity market trends is vital for making well-informed trading decisions. By incorporating these risk management practices, traders can navigate the challenges of commodity trading with Elliott Wave Theory effectively.
Elliott Wave Application
Utilizing Elliott Wave Theory in commodity trading involves a detailed analysis of wave patterns and Fibonacci ratios to interpret market complexities effectively. When applying Elliott Wave Theory to commodity trading, traders should consider the following:
- Structured Framework: Elliott Wave Theory provides a systematic approach to analyzing market movements.
- Wave Patterns: Understanding various wave patterns is essential for accurate market predictions.
- Fibonacci Ratios: Utilizing Fibonacci ratios helps in determining price targets and retracement levels.
- Wave Counts: Traders need to carefully count and interpret waves to make informed trading decisions.
- Technical Indicators: Combining Elliott Wave analysis with technical indicators can enhance trading strategies.
Successful application of Elliott Wave Theory in commodity trading demands a deep understanding of wave analysis and its implications within market complexities.
Technical Analysis Incorporation
When enhancing the accuracy of Elliott Wave Theory predictions in commodity trading, integrating technical analysis tools such as moving averages and trend indicators proves to be invaluable.
Moving averages, like the simple moving average (SMA) or exponential moving average (EMA), help smooth out price data to identify trends. Trend indicators such as the Average Directional Index (ADX) and Ichimoku Cloud can provide additional confirmation to Elliott Wave patterns, aiding traders in making informed decisions.
Momentum indicators like the stochastic oscillator and Moving Average Convergence Divergence (MACD) can assist in pinpointing potential entry and exit points when combined with Elliott Wave analysis. Volume indicators such as On-Balance Volume (OBV) and Accumulation/Distribution Line (A/D Line) complement Elliott Wave analysis by confirming price movements.
Risk Management Strategies
To effectively manage risks associated with commodity trading based on Elliott Wave Theory, implementing robust risk management strategies is imperative for safeguarding capital and optimizing trading outcomes.
When engaging in commodity trading, it is crucial to incorporate the following risk management strategies:
- Implement stop-loss orders to limit potential losses and protect capital.
- Set clear risk-reward ratios to ensure that potential gains outweigh potential losses.
- Diversify your commodity portfolio to reduce risk exposure and mitigate the impact of market volatility.
- Utilize position sizing strategies to manage risk effectively and maintain a balanced approach to trading.
- Regularly review and adjust risk management strategies based on market conditions and individual trading performance.
Trade Execution Tactics
Implementing Fibonacci ratios to pinpoint potential entry and exit points based on wave patterns is a crucial aspect of refining trade execution tactics in commodity trading with Elliott Wave Theory.
By utilizing Fibonacci retracement levels, traders can identify key price levels where a wave is likely to reverse, offering strategic entry and exit points.
Additionally, incorporating stop-loss orders is essential to manage risk and protect capital in case the market moves against the trade.
When integrating Elliott Wave Theory with other technical indicators, such as moving averages or RSI, traders can enhance their confidence in trading signals.
Analyzing wave counts helps in setting profit targets and understanding the direction of commodity price movements within the larger wave structure.
It is advisable for traders to practice these tactics on a demo account first to gain proficiency before executing live trades, ensuring a more disciplined and strategic approach to commodity trading with Elliott Wave Theory.
How Can I Apply Elliott Wave Theory to Commodity Trading for Long Term Success?
To apply Elliott Wave Theory to commodity trading for long term success, it is essential to understand the market cycles and trends. By using Elliott Wave Theory day trading, traders can identify key support and resistance levels, as well as potential reversal points, to make informed decisions and maximize profits in the long run.
Frequently Asked Questions
What Is the Best Indicator to Use With Elliott Wave?
The Fibonacci retracement tool is a crucial indicator to complement Elliott Wave theory. It assists in pinpointing potential reversal levels by leveraging key Fibonacci ratios. Its integration enhances the precision of market analysis and aids in predicting price movements efficiently.
What Is the Best Time Frame to Trade Elliott Wave?
The ideal time frame for trading Elliott Wave theory depends on trading style and objectives. Short-term traders often favor hourly or daily charts for precise wave analysis, while long-term investors may prefer weekly or monthly charts for capturing major trends.
What Is the Success Rate of Elliott Wave Trading?
The success rate of Elliott Wave trading varies based on trader skill and wave pattern interpretation. Experienced analysts can achieve 50-70% success in predicting market movements. Success relies on discipline, risk management, and market understanding.
How Do You Trade Elliott Wave Like a Pro?
Trading Elliott Wave like a pro involves meticulous pattern recognition, precise wave counting, and disciplined risk management. By combining technical indicators for confirmation, traders can enhance their analysis, adeptly navigating the complexities of market waves with skill and expertise.
Conclusion
In conclusion, mastering the principles of Elliott Wave Theory is essential for successful commodity trading. By applying Fibonacci ratios, recognizing wave patterns, integrating indicators, considering market complexities, incorporating technical analysis, implementing risk management strategies, and executing trades tactically, traders can navigate the commodity market with confidence and precision.
Remember, in the world of commodity trading, knowledge is power, and the early bird catches the worm.