
You might have wondered how Bollinger Bands manage to stand out in the realm of trading tools. Their effectiveness lies in a unique blend of simplicity and sophistication, offering traders a window into market dynamics that can guide decision-making with precision.
By harnessing the power of statistical analysis and price action, these bands hold the key to unlocking profitable opportunities in the ever-evolving landscape of financial markets.
Intrigued to uncover the secrets behind their success?
Understanding Bollinger Bands Basics
Have you ever wondered how Bollinger Bands, with their middle band and upper/lower bands, play a crucial role in analyzing market volatility and identifying trading opportunities?
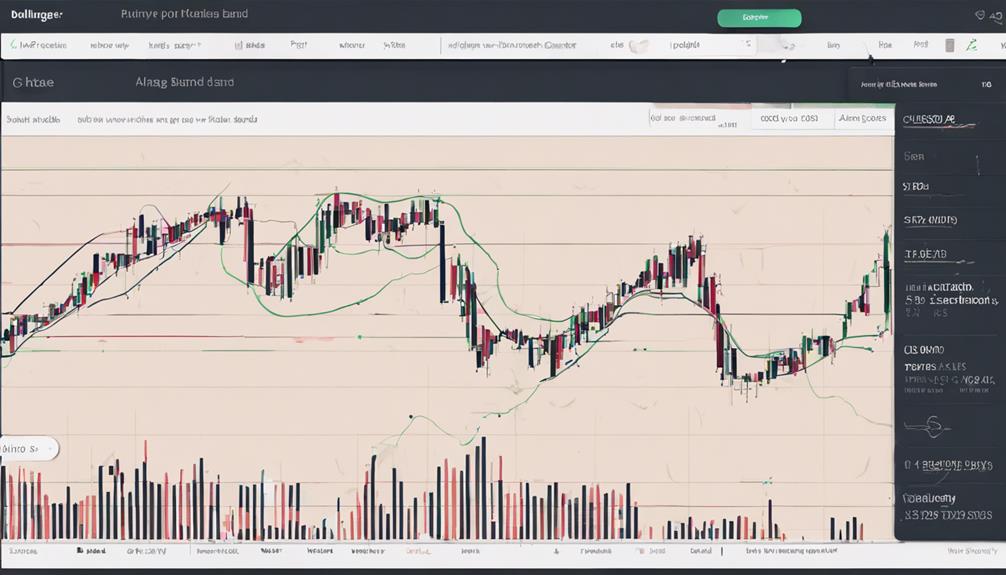
Bollinger Bands, a popular technical indicator, consist of a middle band, typically a 20-day simple moving average, and upper/lower bands determined by adding/subtracting two times the standard deviation from the middle band based on price volatility. These bands serve as dynamic levels of support and resistance, aiding traders in spotting potential trend reversals and breakouts.
The width of the bands reflects market volatility, with wider bands indicating higher volatility levels and narrower bands suggesting lower volatility. By adjusting the lookback periods and standard deviations, traders can tailor Bollinger Bands to align with their trading styles and strategies effectively.
Interpreting Bollinger Bands Signals
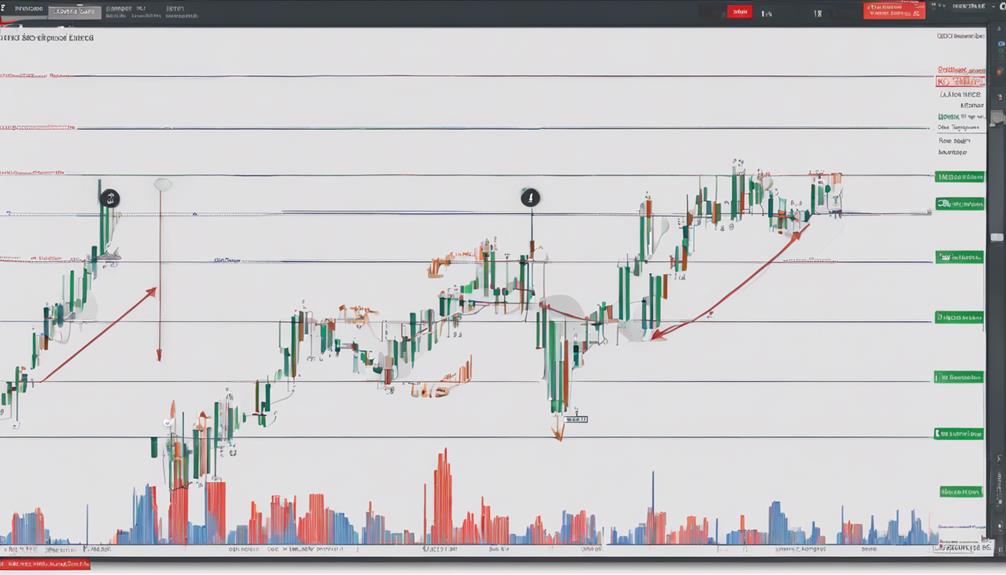
Interpreting Bollinger Bands signals provides traders with valuable insights into market conditions and potential trading opportunities based on price interactions with these dynamic indicators. When analyzing Bollinger Bands signals, keep the following key points in mind:
- Bollinger Bands signal overbought conditions when prices touch the upper band, indicating a potential reversal to the downside, and oversold conditions when they touch the lower band, suggesting a reversal to the upside.
- These bands help identify extremes in price movements and potential trend changes, making them useful for determining entry and exit points.
- By considering the width of the bands, traders can assess market volatility levels, identifying trading opportunities and effectively managing risks in different market conditions.
Implementing Bollinger Bands Strategies
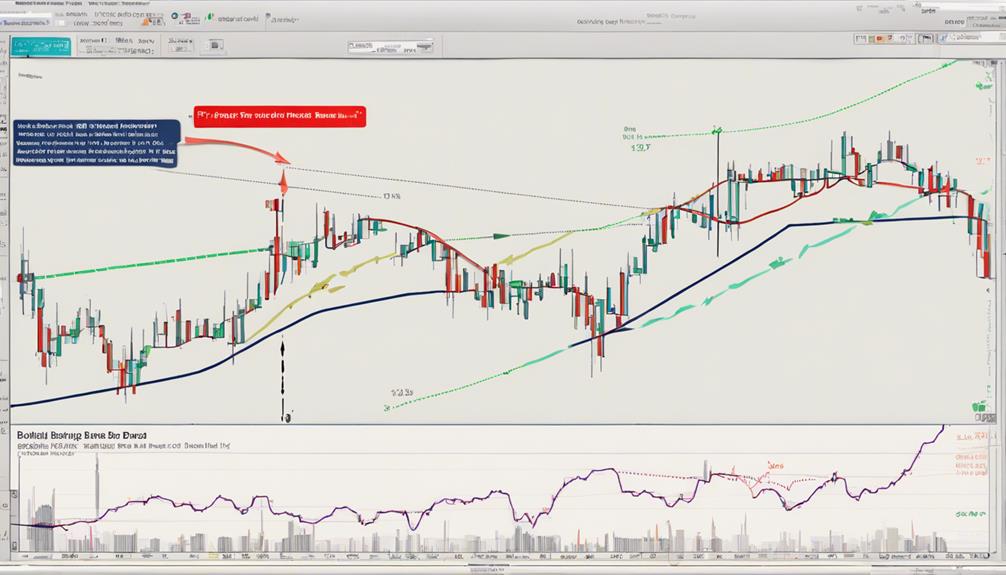
Utilize Bollinger Bands effectively to enhance your trading strategies and optimize entry and exit points in the market. Strategies like the Bollinger Band Squeeze and Bollinger Band Breakouts are tailored to capitalize on market shifts efficiently.
By combining Bollinger Bands with other technical indicators, traders can refine trade signals for better decision-making. These bands also play a vital role in setting stop-loss levels effectively, allowing for proper risk management.
Understanding the characteristics and signals of Bollinger Bands is essential for successful implementation within trading strategies. Whether identifying potential entry points or monitoring market shifts, integrating Bollinger Bands into your trading approach can provide valuable insights and improve overall trading outcomes.
Enhancing Trading With Bollinger Bands

To enhance your trading effectiveness with Bollinger Bands, incorporating multiple bands can illuminate price movement strength and potential breakout opportunities. By understanding the nuances of Bollinger Bands and how they interact with price movements, traders can optimize their trading strategies.
Here are three key ways to enhance your trading with Bollinger Bands:
- Identify overbought and oversold conditions for precise trade signals.
- Utilize Bollinger %B to gauge price position relative to the bands for timely decisions.
- Monitor Bollinger Bandwidth to assess volatility levels, aiding in anticipating potential breakouts or pullbacks.
What Specific Factors Contribute to the Effectiveness of Bollinger Bands in Trading?
Bollinger Bands analysis for traders includes key factors that affect its effectiveness. These include market volatility, trend identification, and timing of trade entries and exits. Understanding how these factors interact with Bollinger Bands can lead to improved decision-making and more profitable trading strategies.
How Can Traders Utilize Bollinger Bands to Improve Their Trading Strategy?
Traders can enhance their strategies with bollinger bands analysis for traders. By using this technical analysis tool, traders can identify overbought and oversold conditions, as well as potential trend reversals. This can help traders make more informed trading decisions and improve their overall trading performance.
Maximizing Bollinger Bands Effectiveness
Maximizing the effectiveness of Bollinger Bands involves strategic adjustments to key parameters like the standard deviation factor and moving average lookback period. By tweaking the standard deviation factor, you can control the bands' sensitivity to price movements, providing insights into potential volatility.
Customizing the moving average lookback period impacts how quickly the bands react to recent price changes, aiding in identifying trends. Enhancing Bollinger Bands with other technical indicators can boost signal accuracy and confirmation, strengthening trading decisions.
Monitoring volume alongside the bands offers additional clues about the strength of price movements. Adapting Bollinger Bands to different timeframes allows for versatile analysis of short-term and long-term trends, maximizing their utility in various market conditions.
Frequently Asked Questions
How Do You Use Bollinger Bands Effectively?
To use Bollinger Bands effectively, focus on identifying market trends, spotting potential reversals, and setting stop-loss levels. Combine them with other indicators for a comprehensive analysis. Enhance your trading decisions by understanding price volatility.
What Are the Advantages of Bollinger Bands?
To understand the advantages of Bollinger Bands, you must recognize their ability to adapt to market volatility, pinpoint overbought or oversold conditions, offer visual insights into price movement, and utilize standard deviations for precise analysis.
What Time Frame Is Best for Bollinger Bands?
For Bollinger Bands, the best time frame varies based on your trading style and goals. Short-term traders often use 5-minute or 15-minute charts, while swing traders prefer daily or weekly charts for broader trends.
How Accurate Is the Bollinger Bands Indicator?
You can trust Bollinger Bands' accuracy in market analysis. They excel at pinpointing overbought/oversold conditions, signaling trend shifts, and predicting breakouts. Combine them with other tools for a comprehensive view before making trading decisions.
Conclusion
You've learned why Bollinger Bands are effective in trading. Did you know that 95% of price action typically falls within the bands, making them a reliable tool for assessing market volatility?
By understanding how to interpret signals, implement strategies, and maximize effectiveness, you can enhance your trading decisions and improve your overall success in the market. Keep utilizing Bollinger Bands to stay ahead of market trends and capitalize on profitable opportunities.