
In the fast-paced world of trading, understanding how standard deviation can be a game-changer in maximizing profits is key. By harnessing the power of this statistical tool, traders can gain insights into market dynamics that go beyond the surface level.
But how exactly does standard deviation translate into tangible gains? Stay tuned as we explore the intricate ways in which this metric can revolutionize trading strategies and propel profits to new heights, all while keeping risk in check.
Importance of Standard Deviation in Trading
Standard deviation plays a pivotal role in the realm of trading by providing traders with a quantitative measure of price variability around the mean, facilitating a comprehensive approach to risk evaluation and mitigation. By analyzing historical price movements and market fluctuations, traders can gauge the level of volatility present in a particular asset. This understanding empowers traders to make informed decisions regarding entry and exit points, adjust position sizes according to market conditions, and optimize risk-reward ratios within their trading strategies.
Moreover, standard deviation is instrumental in setting realistic profit targets and stop-loss orders. Traders utilize this metric to identify potential trading opportunities while managing risks effectively. Incorporating standard deviation into trading strategies enhances profit potential by allowing traders to navigate through dynamic market conditions with greater precision. Overall, the ability to quantify price variability through standard deviation is essential for traders seeking to maximize profits while maintaining a disciplined approach to risk management.
Calculating Standard Deviation for Profits
In financial analysis, the calculation of standard deviation for profit margins provides a quantitative measure of the dispersion of trading results around the mean average. This statistical metric is crucial for traders seeking to assess the variability of price movements and implement effective risk management strategies.
When calculating standard deviation for profits, traders typically follow these steps:
- Determine the mean average of the profit data.
- Calculate the deviations of each profit data point from the mean.
- Square these deviations and sum them up.
- Divide the sum of squared deviations by the number of data points to get the variance.
- Obtain the standard deviation by taking the square root of the variance.
Understanding the standard deviation of profits helps traders analyze market volatility, adjust their trading strategies according to the level of risk associated with an asset or stock, and capitalize on market momentum effectively.
Interpreting Standard Deviation in Markets
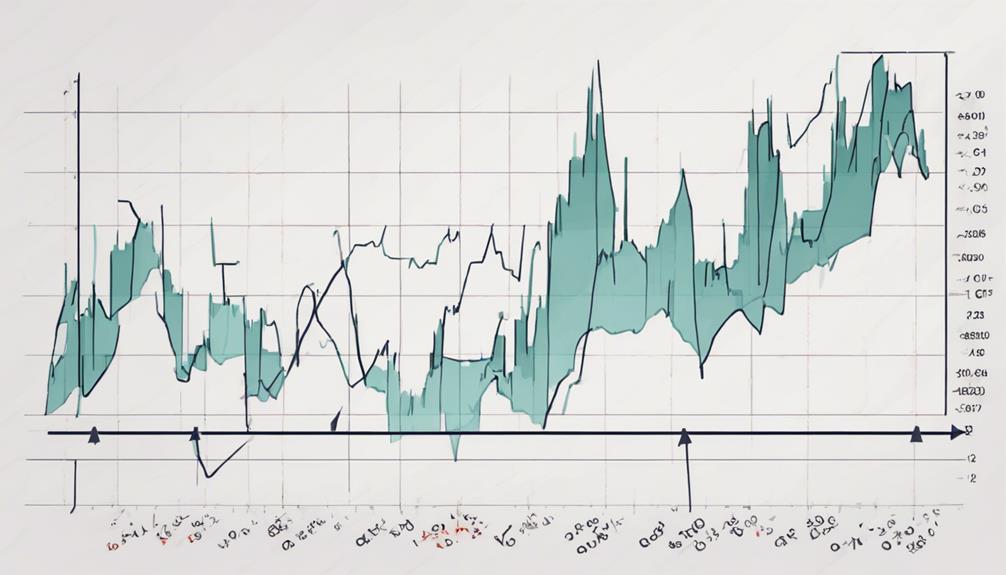
Analyzing market behavior through the lens of standard deviation provides traders with valuable insights into the volatility and risk associated with price movements. Standard deviation, by measuring the dispersion of prices from the average, serves as a crucial tool for risk assessment in trading.
High standard deviation indicates higher volatility, presenting potential profit opportunities for traders willing to take on more risk. On the other hand, low standard deviation signifies lower volatility, offering potentially stable but lower returns in the market.
Interpreting standard deviation allows traders to make informed decisions, guiding them in effective risk management strategies and maximizing trading profits. By understanding the implications of standard deviation on market profits, traders can adapt their trading approaches to suit different market conditions and capitalize on the opportunities presented by price movements.
Ultimately, interpreting standard deviation empowers traders to navigate the market with a comprehensive understanding of the risks and rewards at play.
Managing Risk With Standard Deviation
Utilizing the variability of asset prices around the mean, traders can effectively quantify and manage risk through the application of standard deviation. Standard deviation is a valuable tool in risk management strategies, offering traders a systematic approach to handling market uncertainties.
Here are key ways in which standard deviation is used for managing risk:
- Traders can measure variability using standard deviation to make informed decisions on adjusting position sizes according to the level of market volatility.
- Implementing stop-loss orders based on standard deviation helps in controlling potential losses and safeguarding trading capital.
- Calculating risk-adjusted returns with standard deviation enables traders to fine-tune and optimize their trading strategies for improved performance outcomes.
- Standard deviation assists in identifying overbought or oversold conditions, guiding traders to make timely adjustments to their trading positions.
- By incorporating standard deviation in risk management practices, traders can enhance their ability to optimize trading strategies and make more informed decisions.
Strategies for Profit Maximization

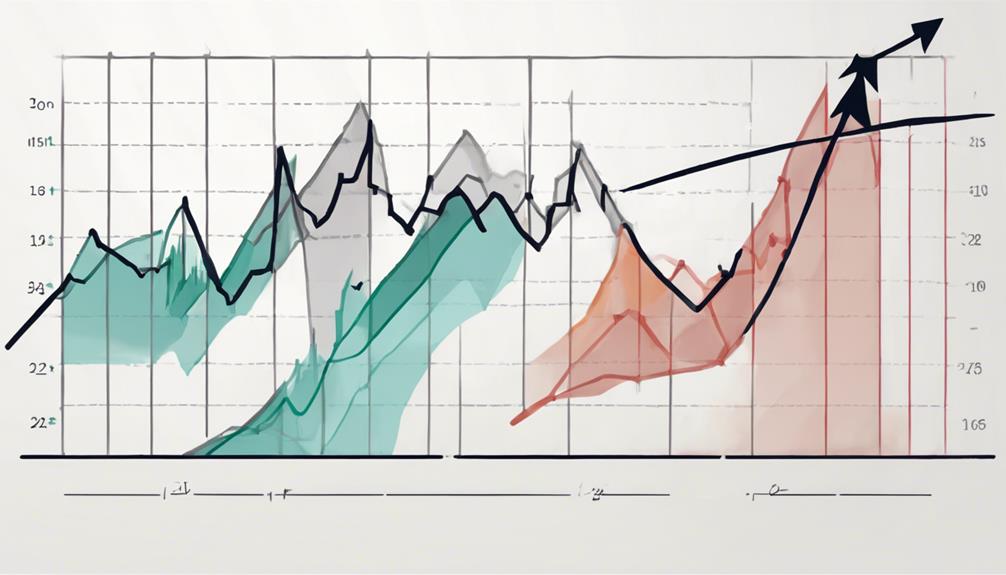
Exploring strategic approaches grounded in standard deviation can significantly enhance profitability in trading endeavors. By incorporating technical analysis tools like Bollinger Bands, traders can capitalize on price swings driven by volatility. Setting profit targets based on historical price volatility allows for more informed decision-making, aligning expectations with market conditions.
Adjusting position sizes in accordance with standard deviation enables traders to optimize profit potential while effectively managing risk. Identifying precise entry and exit points through standard deviation analysis enhances the likelihood of successful trades. Implementing robust risk management strategies based on standard deviation minimizes potential losses and safeguards profit margins.
Constant monitoring of standard deviation levels equips traders to adapt swiftly to changing market dynamics. By integrating standard deviation into trading methodologies, individuals can navigate market uncertainties with a data-driven approach, ultimately maximizing profitability.
How Can Standard Deviation Help in Maximizing Trading Profits?
Implementing standard deviation strategy in trading can help maximize profits by identifying potential price movements. By analyzing the volatility of a stock or market, traders can make informed decisions on when to buy or sell, ultimately increasing their chances of success. Understanding standard deviation can be a valuable tool in the trading world.
Frequently Asked Questions
How Do You Use Standard Deviation in Trading?
Standard deviation in trading is utilized to gauge historical volatility, set price targets, manage risk, and adjust position sizes. It aids in measuring risk-adjusted returns, analyzing market momentum, and identifying entry and exit points based on market fluctuations.
How Do You Maximize Trading Profits?
To maximize trading profits, implement sound risk management strategies, conduct thorough market analysis, and make informed decisions based on data-driven insights. Utilize effective position sizing, set appropriate stop-loss orders, and capitalize on profitable trading opportunities to optimize profit margins.
What Standard Deviation Is Good for Stocks?
A desirable standard deviation for stocks typically reflects a balance between risk and potential reward. Optimal levels vary based on investor preferences, with lower values indicating stability and higher values suggesting increased volatility and potential profit opportunities.
What Does Standard Deviation Say About Stock Volatility?
Standard deviation measures stock price volatility, showing how much prices deviate from the mean. High standard deviation signifies greater price fluctuations, indicating riskier investments. Conversely, low standard deviation suggests stability with less risk. Understanding this helps traders manage risk effectively.
Conclusion
In conclusion, standard deviation serves as a valuable tool for traders seeking to maximize profits while effectively managing risk. By utilizing this statistical measure to analyze market volatility and momentum, traders can make informed decisions and adjust their strategies accordingly.
Incorporating standard deviation into risk management practices can lead to more efficient trading outcomes and increased profit margins. Remember, when it comes to trading, the numbers don't lie – so let standard deviation be your guide to success in the markets.