
As you observe the flickering dance of candlestick patterns on your screen, each formation whispers a tale of market sentiment and potential price movements. Understanding these intricate patterns can be the key to unlocking profitable opportunities in day trading.
By mastering the art of deciphering candlestick signals, you hold the power to anticipate market shifts and capitalize on emerging trends. In a world where split-second decisions can make or break a trade, arming yourself with the knowledge of interpreting these patterns is an invaluable asset that sets you apart from the crowd.
Candlestick Pattern Basics
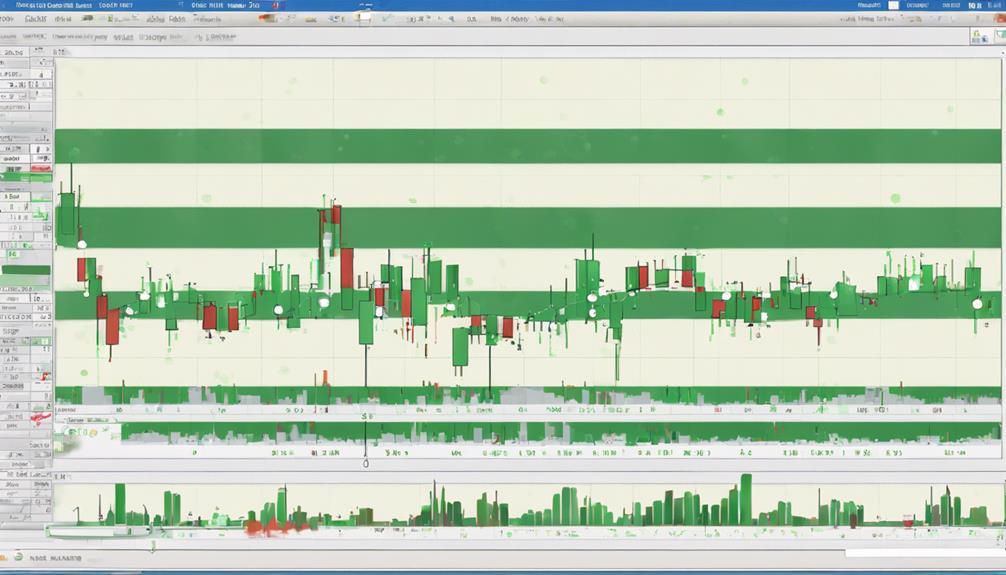
When analyzing day trading candlestick patterns, it's essential to grasp the fundamental aspects of candlestick pattern basics. Candlestick patterns are visual representations of price movements in the market, depicted through a series of open, high, low, and close prices within a specific timeframe.
The body of a candlestick, whether red or green, indicates the price range between the open and close, with long bodies suggesting significant buying or selling pressure. These patterns, such as doji, hammer, engulfing, and morning star patterns, provide valuable insights into market sentiment and potential reversals.
Utilizing these chart formations alongside other technical indicators can enhance your ability to make informed trading decisions based on the patterns' predictive nature.
Bullish Candlestick Patterns
In day trading, recognizing bullish candlestick patterns plays a crucial role in identifying potential price reversals and strategic entry points for long trades. Examples of bullish candlestick patterns include the Hammer, Inverse Hammer, and Bullish Engulfing patterns. These patterns signify buying pressure in the market, indicating opportunities for taking long positions.
By understanding these patterns, traders can pinpoint entry points for initiating trades that capitalize on upward price movements. Incorporating bullish candlestick patterns into trading strategies can help traders anticipate potential reversals and optimize their chances of profiting from market trends.
It's essential to grasp the significance of these patterns to make informed decisions and enhance trading outcomes.
Bearish Candlestick Patterns
Bearish candlestick patterns signal potential price declines in the market, indicating selling pressure and a shift from bullish to bearish sentiment. Examples like the Bearish Engulfing, Hanging Man, and Shooting Star patterns are crucial for traders.
These patterns serve as entry points for short positions, allowing traders to capitalize on downward price movements. Recognizing bearish candlestick patterns is fundamental for effective risk management strategies in day trading.
Common Reversal Candlestick Patterns
Reversal candlestick patterns in day trading serve as crucial indicators for potential shifts in price direction. Recognizing patterns like the Hammer, Shooting Star, and Engulfing can help traders identify trend reversals or corrections.
Understanding these candlestick patterns is essential for anticipating market shifts and making informed trading decisions. When these reversal patterns emerge, it's vital to seek confirmation through additional market analysis before acting.
Application in Day Trading
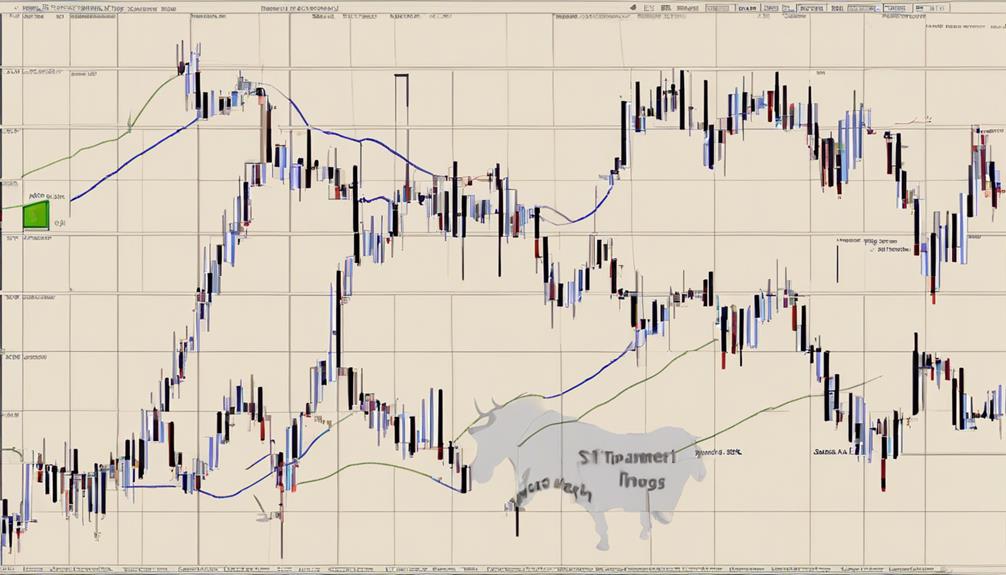
Utilize day trading candlestick patterns to effectively analyze short-term price movements and pinpoint potential entry and exit points for swift trades. Day traders rely on candlestick chart patterns like hammers, engulfing candles, and the bullish engulfing pattern to interpret price action and make informed decisions.
These patterns serve as valuable indicators for identifying market sentiment and predicting short-term price movements. By recognizing bearish reversal candlesticks and other patterns, traders can strategically plan their entry and exit points to capitalize on market fluctuations.
Successful day trading involves utilizing these candlestick patterns to interpret market dynamics quickly and accurately. Incorporating these patterns into your trading strategy enhances your ability to react promptly to changing market conditions and maximize profit potential.
Are Forex Candlestick Patterns Similar to Day Trading Candlestick Patterns?
Yes, reading forex candlestick patterns is similar to day trading candlestick patterns. Both involve the analysis of price movements within a specific timeframe to identify potential trading opportunities. Understanding these patterns can help traders make informed decisions and predict market movements more accurately.
Frequently Asked Questions
How Do You Read Candlesticks for Day Trading?
To read candlesticks for day trading, observe body size, wicks, and colors. Analyze these elements for trend identification. Focus on intraday patterns for quick decisions. Understanding formations helps anticipate market moves. Accurate interpretation is vital for success.
What Is the Best Candlestick Pattern for Day Trading?
In day trading, the best candlestick pattern varies based on your strategy and risk tolerance. Look for signals like Doji, Hammer, Engulfing, or Morning Star patterns for potential price changes within the day.
How Do You Analyze Candlestick Patterns?
To analyze candlestick patterns, observe the relationship between open, high, low, and close prices. Study the color and size of candle bodies to gauge market sentiment. Pay attention to wick length and direction to identify highs and lows.
How Do You Read and Interpret a Candlestick Chart?
To read and interpret a candlestick chart, observe the body representing opening and closing prices. Note the color (green for rise, red for fall). Look at the wicks showing highs and lows. Analyzing these elements aids in predicting market movements.
Conclusion
In conclusion, mastering candlestick patterns is crucial for successful day trading. By understanding the language of the market through these patterns, you can navigate price movements with confidence.
Like a skilled artist interpreting brushstrokes on a canvas, traders who can decipher candlestick patterns can anticipate market trends and make well-informed decisions.
Keep honing your skills and observing the nuances of candlesticks to enhance your trading strategies.