
So, you think you've got a handle on market trends? Well, before you make any moves, consider this: mastering market trend analysis with volume indicators can be the game-changer you didn't know you needed.
By understanding how volume indicators can impact your trading decisions, you might just uncover hidden opportunities and avoid costly mistakes.
Let's explore how these 7 tips can elevate your trading game and give you an edge in the ever-evolving market landscape.
Understanding Volume-Based Indicators
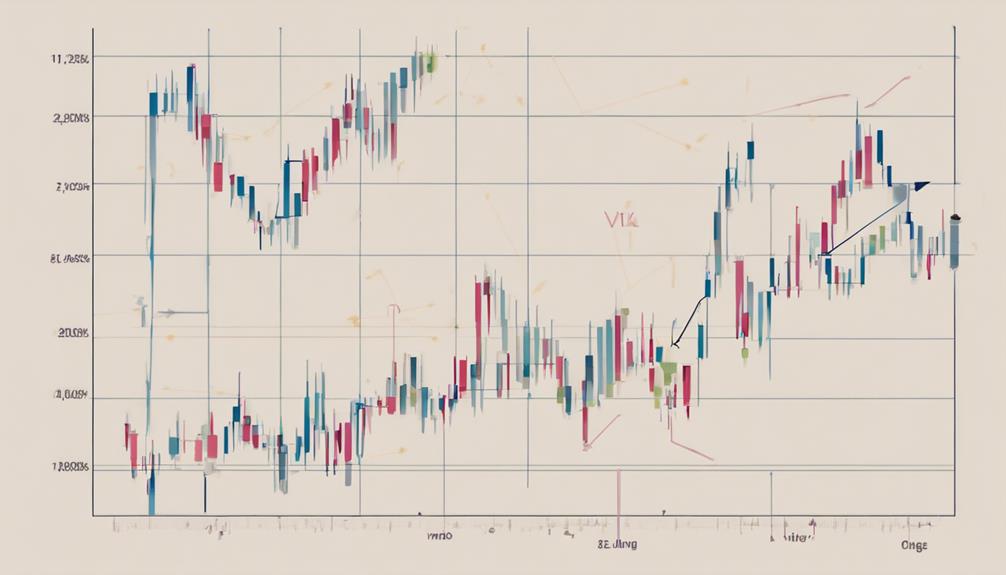
When analyzing market trends, understanding volume-based indicators is crucial for evaluating buying and selling pressure. Volume-based indicators like On Balance Volume (OBV) and Chaikin Money Flow play a vital role in technical analysis by assessing the relationship between volume and price movements. These indicators offer valuable insights into market sentiment, helping traders gauge the strength of price trends and potential reversals.
Importance of High Volume Analysis

Analyzing market trends through high volume analysis offers valuable insights into the strength and potential movements of a stock. High volume indicates significant market interest, affirming market strength.
In an uptrend analysis, increasing volume supports upward price movement, indicating potential price appreciation. Traders can use high volume as a guide to identify buying or selling opportunities, as it often precedes significant price movements.
Monitoring volume levels is essential for understanding market dynamics and making informed trading decisions. By paying attention to high volume activity, traders can better assess the market's sentiment and anticipate possible shifts in stock prices, enabling them to make more strategic trading decisions.
Utilizing Low Volume Signals
When analyzing low volume signals, it's crucial to understand the significance of volume thresholds and the challenges that come with interpreting these signals accurately.
Low volume periods can signal potential market shifts, but they also require careful assessment to differentiate between temporary fluctuations and significant trends.
Recognizing the nuances of low volume signals can help you make more informed decisions in your trading strategies.
Volume Threshold Importance
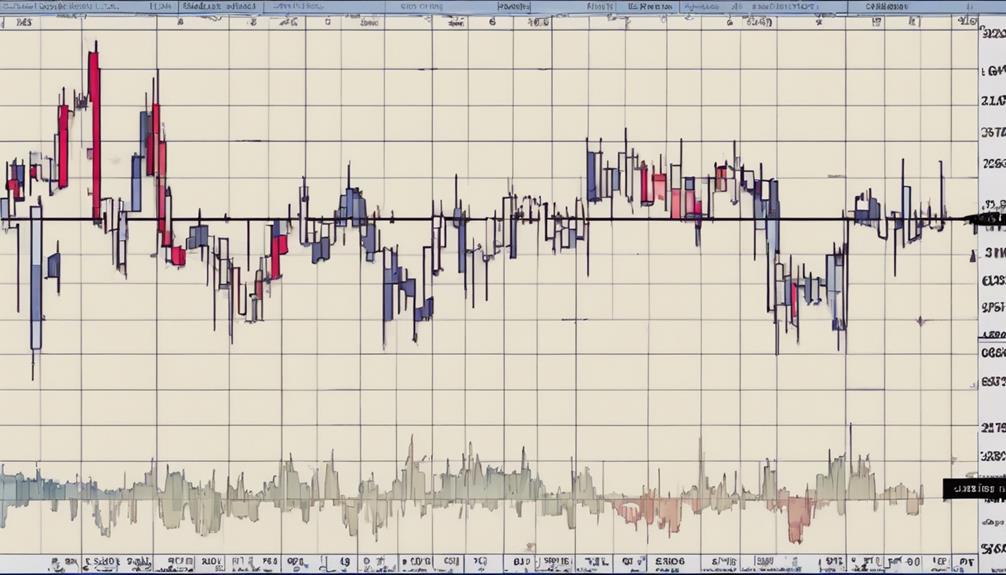
Monitoring volume thresholds allows traders to pinpoint key levels where low volume signals potential caution or uncertainty in market trends.
Low volume signals often indicate a lack of market interest or participation, raising concerns about the strength of a trend.
Traders seek confirmation of market trends through volume analysis, particularly when volume levels are below average.
A notable drop in trading volume alongside a price move may suggest weakening momentum or a possible trend reversal.
By utilizing volume thresholds, traders can identify critical levels where low volume could signify a need for caution.
This approach provides valuable insights into market sentiment and helps anticipate shifts in price direction, aiding in making informed trading decisions.
Interpretation Challenges
Navigating market trends with low volume signals poses significant challenges for traders aiming to interpret price movements accurately. Low volume signals make it difficult to confirm the strength of a trend, often leading to false signals and misinterpretation of market direction. Traders must exercise caution when relying on low volume signals for trend analysis.
It's crucial to seek confirmation from other technical indicators to validate signals in such scenarios. Without this confirmation, the risk of making incorrect market decisions increases. Therefore, when faced with low volume signals, traders should proceed with diligence and consider multiple factors to ensure a more accurate analysis of the market trend.
Applying Volume RSI Strategies
When considering Volume RSI strategies, focus on understanding the basics, interpreting the signals, and exploring practical applications.
By grasping these key points, you can effectively gauge market dynamics and potential trading opportunities.
Volume RSI insights can offer a comprehensive view of market sentiment and guide your decision-making process.
Volume RSI Basics
Volume RSI, a crucial volume-based indicator, provides traders with valuable insights into market sentiment and potential price reversals by oscillating around the 50% center-line based on volume data. When delving into Volume RSI basics, keep in mind the following key points:
- Combines volume and price data to gauge buying and selling pressure.
- Helps in determining the strength of price movements through volume trends.
- Analyzes market sentiment for informed decision-making.
- Identifies potential price reversals in the market.
Understanding Volume RSI strategies can significantly enhance your market trend analysis and decision-making processes.
Volume RSI Signals
Utilizing Volume RSI signals in your trading strategy enhances your ability to interpret market dynamics and make well-informed decisions based on volume-based indicators. These signals help analyze the buying and selling pressure in the market, indicating overbought or oversold conditions as the Volume RSI oscillates around the 50% center-line.
Crossing above 50% suggests bullish momentum, while crossing below 50% indicates bearish momentum. By combining Volume RSI analysis with price trends, traders can confirm market trends and strengthen their trading decisions.
Understanding the implications of Volume RSI signals can provide valuable insights into market dynamics, enabling traders to navigate market trends effectively and make informed trading choices.
Volume RSI Applications
To enhance your trading strategy effectively, consider leveraging Volume RSI applications by analyzing trends in volume and price data.
- Utilize Volume RSI to assess the strength of price trends and identify overbought and oversold conditions.
- Analyze buying and selling pressure in the market by combining trading volume and price trends.
- Look for divergences between price and volume movements to anticipate potential trend reversals.
- Use Volume RSI to confirm existing trends and spot opportunities for entering or exiting trades.
- Employ Volume RSI strategies to gauge market sentiment and make informed decisions based on the interplay between volume and price data.
Leveraging Volume Price Trend Indicator
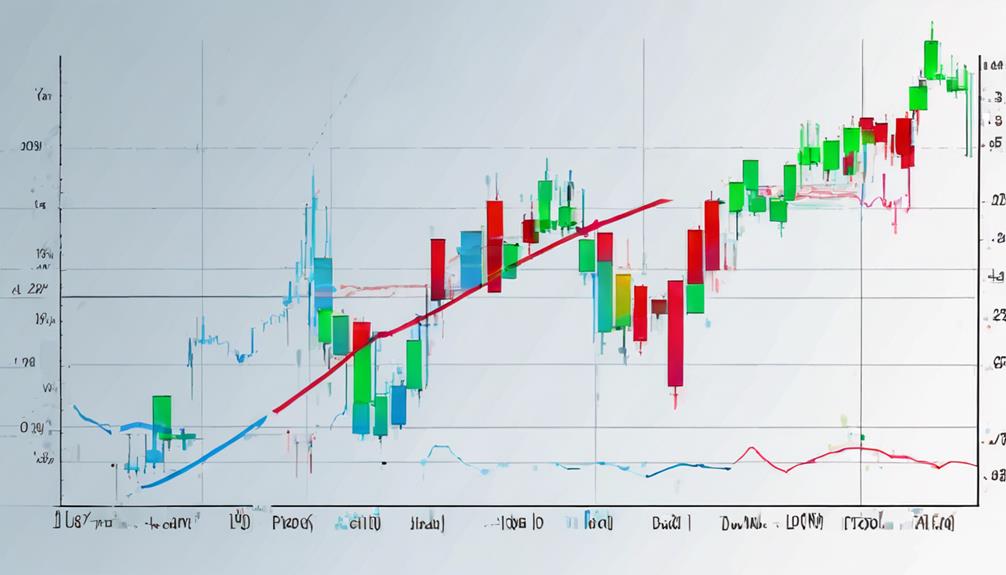
Analyzing price trends through the lens of the Volume Price Trend Indicator (VPT) provides traders with valuable insights into market dynamics and potential trend reversals. VPT calculates the relationship between price and volume, offering a clear indication of price momentum.
By adding or subtracting a percentage of daily volume based on price changes, VPT helps confirm price trends and identify potential reversals or continuations driven by volume. Traders leverage VPT to analyze the direction and magnitude of volume-adjusted price changes, gaining insights into market sentiment and the sustainability of price trends.
This volume-driven approach, integrating both price and volume data, enhances understanding of price action dynamics and aids in making informed trading decisions.
Money Flow Analysis Techniques
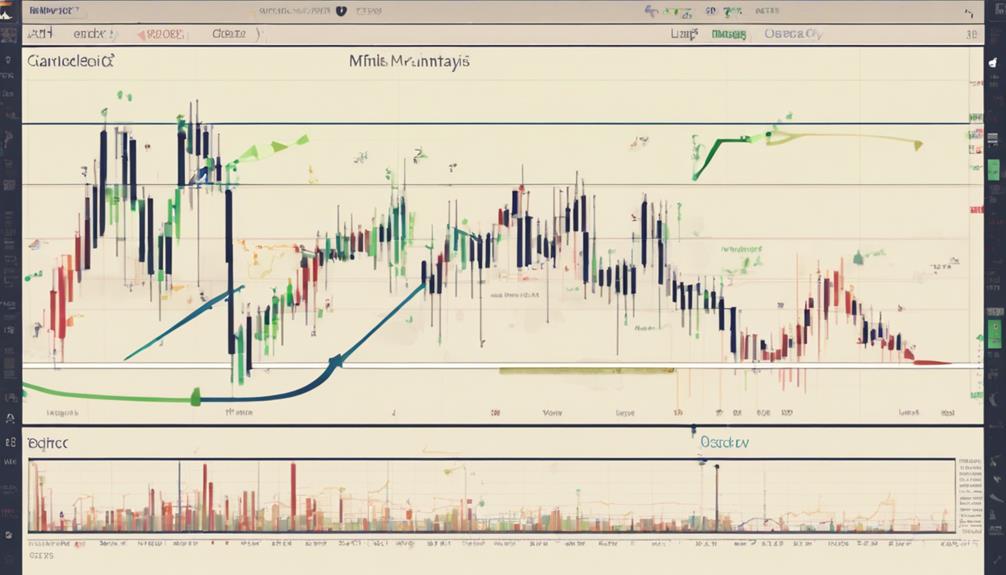
Tracking the flow of money into and out of a security is crucial in market analysis. Techniques like the Chaikin Money Flow Indicator and accumulation/distribution indicators provide valuable insights. When analyzing money flow, consider these points:
- The Chaikin Money Flow Indicator measures the flow of money in the market.
- Accumulation/distribution indicators assess buying and selling pressure based on volume.
- The r indicator combines price and volume analysis for market trend insights.
- Understanding money flow analysis techniques aids in identifying market trends.
- This analysis helps in making informed trading decisions based on buying and selling pressure.
Using Chaikin Money Flow Indicator
When utilizing the Chaikin Money Flow Indicator, traders can effectively measure buying and selling pressure by combining price and volume data. Positive CMF values indicate buying pressure, while negative values suggest selling pressure. By analyzing CMF, traders can identify potential price trends and confirm the strength of the current trend in the market.
This information is crucial for understanding market sentiment and predicting potential price movements. Incorporating the Chaikin Money Flow Indicator into market trend analysis provides valuable insights that can help traders make informed decisions and stay ahead of market fluctuations.
Frequently Asked Questions
How Do You Use a Volume Indicator Effectively?
To use a volume indicator effectively, pay attention to buying/selling pressure, divergences with price, volume patterns during breakouts, and historical data comparisons. Incorporate these insights into your trading strategy for better decision-making.
How Do You Confirm a Trend With Volume?
To confirm a trend with volume, observe increasing volume in the trend's direction. Rising prices with growing volume support an uptrend. Falling prices coupled with rising volume indicate a strong downtrend. Volume analysis is vital for trend sustainability.
How Do You Identify a Trend With an Indicator?
To identify a trend with an indicator, focus on price movements and volume patterns. Look for consistent higher highs and higher lows in an uptrend or lower lows and lower highs in a downtrend. Confirm with volume indicators for accuracy.
How Do You Use Volume Price Trend Indicator?
Wondering how to use the volume price trend indicator effectively? Assess price movements based on trade volume strength. Rising values indicate robust trends, while falling values suggest weakening momentum. Use it for informed trading decisions and trend confirmation.
Conclusion
Incorporate volume indicators like OBV and Chaikin Money Flow to analyze market trends effectively. Identify buying and selling pressure, trend strengths, and potential reversals for informed trading decisions. High volume signals strong interest, while low volume may indicate weak enthusiasm. Utilize volume RSI and Volume Price Trend Indicator for comprehensive analysis.
Money flow techniques and Chaikin Money Flow Indicator offer valuable insights. Enhance your trading strategies with volume analysis to improve success in the market.