
You might not be aware that mastering the interpretation of RSI movements can significantly enhance your trading decisions.
By breaking down the 10 key steps to understanding RSI, you can unlock valuable insights into market trends and potential reversals.
From identifying overbought and oversold levels to analyzing divergence and failure swings, each step plays a crucial role in your trading strategy.
Stay tuned to discover how these steps can elevate your trading game and lead to more informed decision-making in the dynamic world of stock trading.
Understanding Relative Strength Index (RSI)
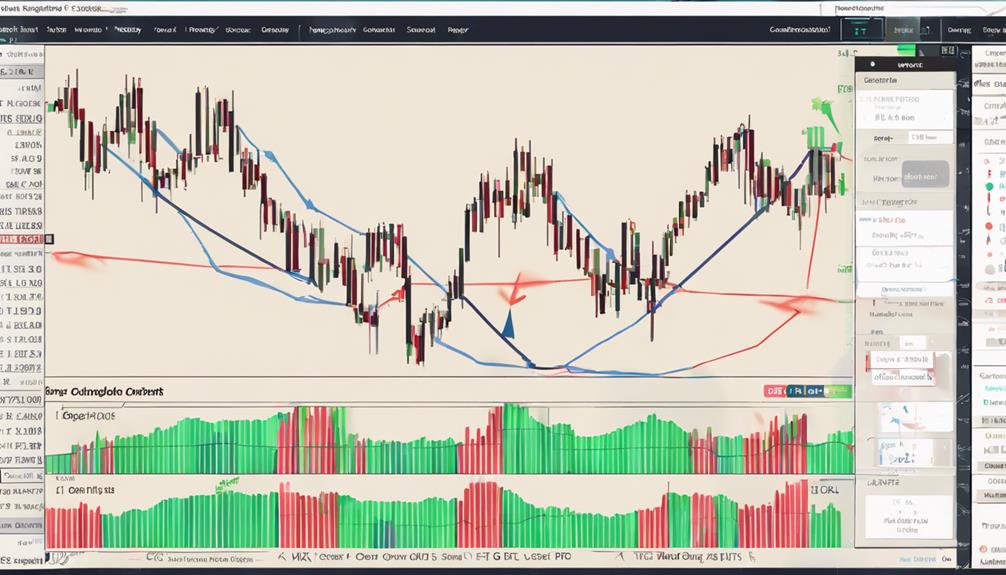
When analyzing market momentum, the Relative Strength Index (RSI) serves as a crucial tool for traders and investors. RSI calculates momentum by comparing average gains and losses within a specified period, helping to gauge the strength of price movements.
Levels below 30 on the RSI suggest oversold conditions, while levels above 70 indicate overbought conditions. Traders utilize RSI to identify potential entry and exit points, recognizing momentum shifts.
Moreover, RSI aids in determining trend reversals by identifying divergences between price movements and RSI readings. Understanding how RSI reflects these aspects can assist you in making informed decisions in the dynamic world of trading and investing.
Identifying Overbought and Oversold Levels
To effectively navigate market dynamics, pinpointing overbought and oversold levels through the Relative Strength Index (RSI) is crucial for strategic decision-making. RSI values above 70 indicate overbought conditions, potentially signaling a reversal or correction, while levels below 30 suggest oversold conditions, indicating a possible buying opportunity.
Some assets, especially those with high volatility, may use 80 and 20 levels for overbought and oversold indications to align with their price movements. Overbought assets exceed their intrinsic value, hinting at an impending price adjustment.
Traders frequently utilize RSI levels to assess the bullish or bearish sentiment in the market, aiding in making optimal decisions based on market sentiment and potential reversals.
Recognizing Divergence in Price and RSI
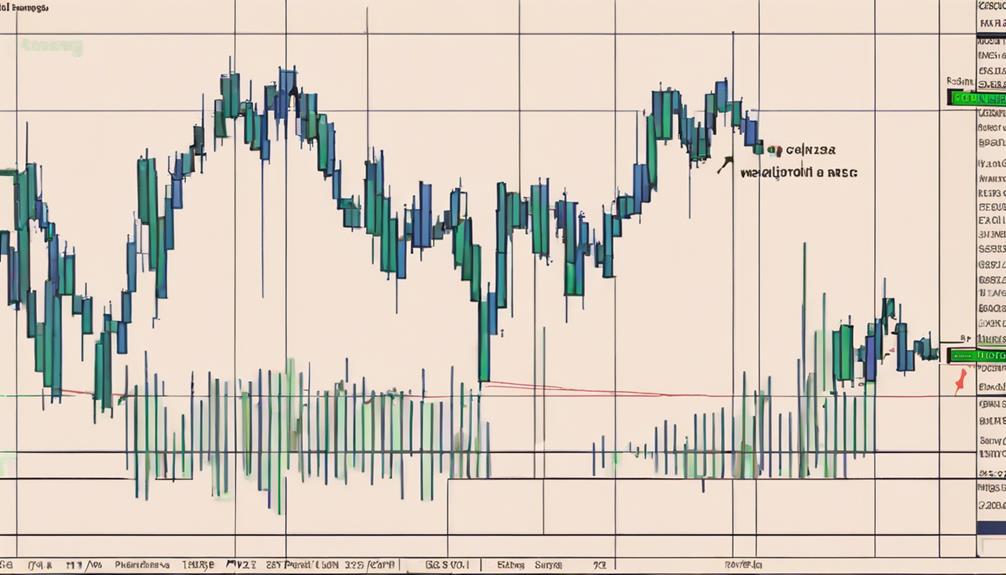
When analyzing price and RSI divergence, you can identify potential trend reversals by comparing the movement of the stock price with the RSI indicator.
Bullish divergence occurs when the stock price makes lower lows while the RSI makes higher lows, signaling a possible uptrend.
Conversely, bearish divergence is seen when the stock price shows higher highs while the RSI displays lower highs, indicating a potential downtrend.
Price-RSI Divergence Detection
A crucial aspect of technical analysis involves identifying instances of Price-RSI divergence, where stock price movement contradicts the behavior of the RSI indicator. Price-RSI divergence can provide valuable insights into potential trend reversals. When analyzing divergence, keep in mind the following:
- Bullish Divergence: Occurs when the stock makes lower lows while the RSI makes higher lows, signaling a potential bullish reversal.
- Bearish Divergence: Identified when the stock shows higher highs while the RSI shows lower highs, indicating a potential bearish reversal.
- Recognizing Divergence: Helps traders anticipate shifts in stock price movements.
- Key Concept: Price-RSI divergence is essential in technical analysis for making informed trading decisions.
Interpreting Signal Differences
Interpreting signal differences, specifically recognizing divergence in both price and RSI, is a critical skill for traders seeking to anticipate market shifts accurately. Divergence, whether bullish or bearish, indicates potential trend reversals when price movements contradict RSI readings.
Bullish divergence, characterized by lower lows in prices and higher lows in RSI, suggests a forthcoming bullish reversal. Conversely, bearish divergence, where prices form higher highs while RSI forms lower highs, hints at a possible bearish reversal.
Identifying these divergence signals is essential for traders as it enhances the technical analysis of RSI in predicting changes in trends. By understanding and acting upon these divergence patterns, traders can better anticipate shifts in market direction and make informed trading decisions.
Analyzing Failure Swings
Analyzing Failure Swings reveals crucial market signals for traders seeking trend reversals in RSI movements.
- Failure swings in RSI can signify potential shifts in market direction during both uptrends and downtrends.
- A Failure Swing Top in RSI indicates potential selling opportunities for traders.
- Conversely, a Failure Swing Bottom suggests potential buying opportunities for traders.
- By identifying failure swings, traders can effectively pinpoint RSI divergences and make informed trading decisions based on these signals.
Understanding how to interpret failure swings enhances traders' ability to utilize RSI effectively, enabling them to navigate market trends and capitalize on potential opportunities for profit.
Utilizing RSI Ranges
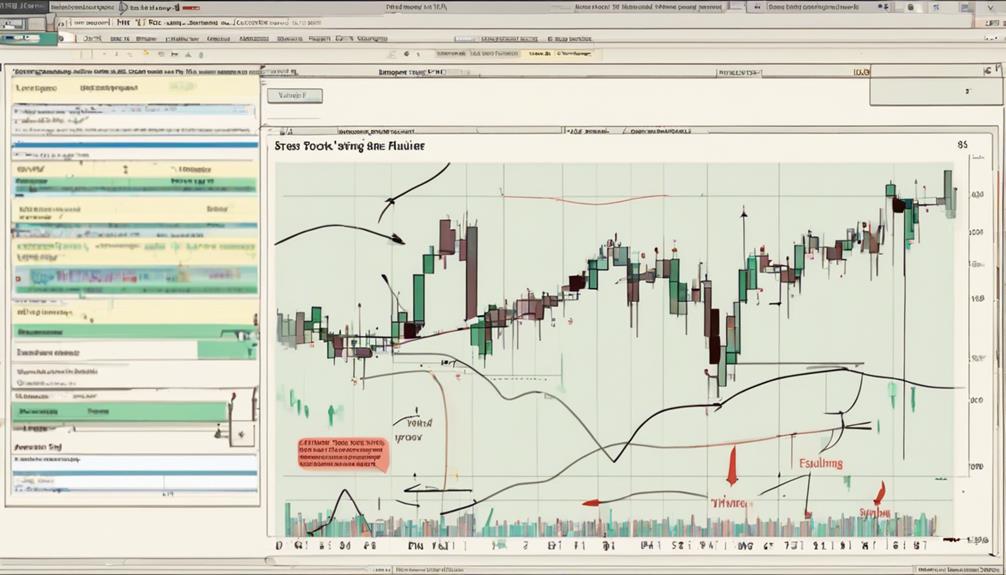
Utilize RSI ranges to identify potential overbought and oversold conditions in the market. The relative strength value typically suggests overbought levels when exceeding 70 and oversold levels when falling below 30.
In uptrends, RSI often remains within the 40-90 range, finding support around 40-50. Conversely, downtrends see RSI fluctuating between 10-60, with resistance forming near 50-60. Adjust these ranges based on the security's behavior and trend strength.
Look for bullish divergence near oversold levels for potential entry points and bearish divergence near overbought levels for potential exits. Be cautious of new highs or lows that lack RSI confirmation, as they could indicate an impending trend reversal.
Noting RSI Trendline Breaks
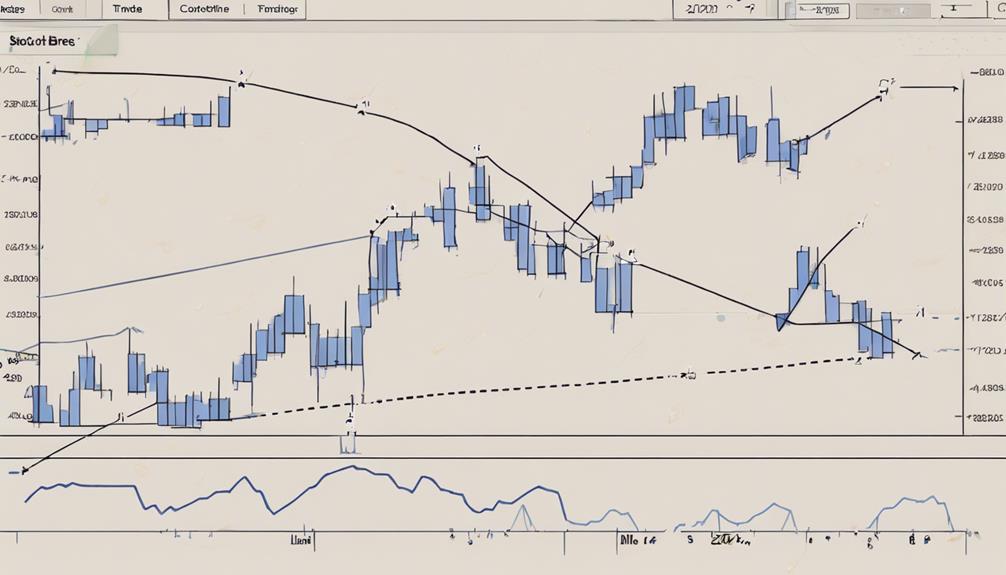
When noting RSI trendline breaks, you should pay close attention to identifying breaches in the trendlines. React promptly to these breaks as they can indicate potential shifts in market sentiment or trend directions.
Utilize trendline confirmation in conjunction with other technical indicators for a more robust analysis.
Identifying Trendline Breaches
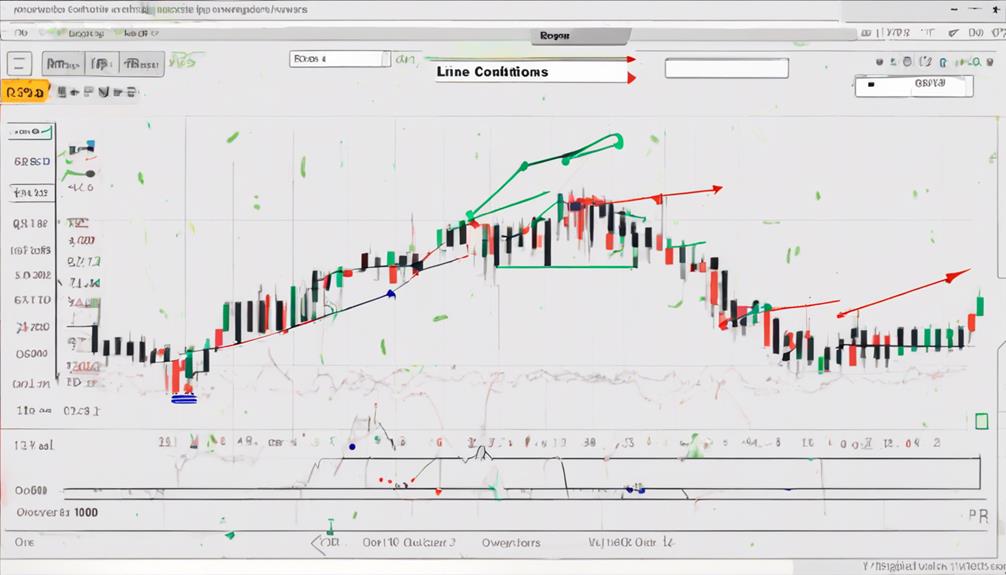
To identify trendline breaches in RSI movements, look for instances where the RSI indicator breaks through a trendline drawn on its values.
- RSI trendline breaches can indicate potential trend reversals or the continuation of the current trend.
- Traders seek sustained breaks above or below RSI trendlines for confirmation of price movements.
- These breaches offer visual confirmation of momentum shifts in the underlying asset.
- Monitoring RSI trendline breaks aids traders in making informed decisions on entry and exit points in the market.
Analyzing RSI trendline breaches is crucial for understanding market dynamics and making strategic trading decisions. By recognizing these breaks, you can gain valuable insights into the momentum and potential shifts in the underlying asset.
Reacting to Trend Shifts
By recognizing RSI trendline breaks, you can effectively respond to shifts in market trends and make informed trading decisions based on momentum indicators. When the RSI trendline breaks above 70, signaling overbought conditions, it may indicate a potential reversal.
Conversely, a break below the 30 level suggests oversold conditions and a possible bullish reversal. Monitoring RSI trendline breaks helps anticipate trend changes and identify momentum shifts. These breaks can provide confirmation for trading decisions by validating other technical indicators.
Reacting to RSI trendline breaks can enhance your trading strategies, assisting in determining entry and exit points in the market. Stay vigilant for these breaks to capitalize on opportunities and optimize your trading approach.
Utilizing Trendline Confirmation
Utilizing trendline confirmation through noting RSI trendline breaks enhances the precision of market analysis and aids in identifying potential trend reversals. When monitoring RSI trendlines, consider the following:
- Drawing trendlines on RSI charts can highlight key support and resistance levels, offering crucial insights into potential price movements.
- Breakouts above or below RSI trendlines may signal shifts in market sentiment, indicating potential trend reversals.
- Trendline confirmation in RSI analysis validates price action signals, providing a more robust basis for trading decisions.
- Monitoring RSI trendlines alongside price trends enhances technical analysis accuracy, enabling traders to make more informed predictions about market movements.
Comparing RSI With MACD
When comparing RSI with MACD, understanding their distinct focus areas and calculation methods is crucial for informed decision-making in trading. MACD is a trend-following momentum indicator, providing buy and sell signals based on crossovers with its signal line.
On the other hand, RSI focuses on identifying overbought and oversold conditions while also gauging momentum. Traders rely on MACD for trend confirmation and potential entry/exit points, whereas RSI helps assess the strength of price movements.
Contradictory signals between RSI and MACD can occur due to their unique approaches. Recognizing these differences enables traders to make more informed decisions when interpreting these indicators, ultimately enhancing their trading strategies.
Exploring Momentum Indicators
Exploring momentum indicators allows traders to delve deeper into the dynamics of price movements, providing valuable insights for strategic decision-making in trading.
- Momentum indicators such as RSI gauge the speed and magnitude of price changes.
- RSI fluctuates between 0 and 100, indicating overbought and oversold market conditions.
- Divergences observed in RSI movements can hint at potential trend reversals.
- RSI tends to establish specific levels during uptrends and downtrends, offering support and resistance levels for traders to consider.
Understanding how RSI behaves under various market conditions enhances its utility in predicting future price movements accurately. By incorporating RSI and its nuances into your trading strategy, you can better anticipate potential price shifts and make informed trading decisions.
Application of RSI in Trends
To effectively leverage RSI in trend analysis, traders must grasp the key ranges that signify trend strength and potential reversal points. In an uptrend, RSI typically fluctuates between 40 and 90, finding support in the 40-50 zone.
Conversely, during a downtrend, RSI often stays within the 10-60 range, encountering resistance in the 50-60 zone. These ranges can vary based on the security's behavior and trend robustness.
Identifying potential trading opportunities involves watching for signs like bearish or bullish divergences, where RSI fails to confirm new highs or lows. Additionally, paying attention to when RSI crosses back from overbought or oversold territories can help pinpoint potential trend shifts in the stock market.
How Can I Use RSI Movements to Master Technical Analysis?
Learning stepbystep RSI analysis techniques can help you master technical analysis. By using RSI movements, you can identify overbought and oversold conditions, trend reversals, and potential price breakouts. This can give you valuable insights for making informed trading decisions and maximizing your profits in the market.
Examining RSI Limitations
RSI's effectiveness in signaling potential market shifts can be hampered by various limitations that traders should carefully consider.
- RSI can remain overbought or oversold for extended periods, limiting its reliability.
- Interpreting RSI requires subjectivity, which can benefit from individual analysis.
- Tech traders might use RSI to potentially help identify trading opportunities.
- Investors define oversold and overbought levels differently, impacting RSI's efficacy.
Despite its limitations, incorporating RSI alongside other confirmation indicators can help investors measure momentum and find potential trading insights.
However, except investors use overbought conditions, relying solely on RSI readings may not always yield accurate results. It's essential to understand that using RSI doesn't always mean making immediate trading decisions, but rather integrating it into a comprehensive analysis strategy.
Frequently Asked Questions
How Do You Interpret RSI Values?
To interpret RSI values, you analyze overbought levels above 70 and oversold levels below 30. Look for buy or sell signals when RSI lines cross. RSI helps predict trends and reversals, with divergences and swing rejections offering valuable insights.
What Are the Key Levels of Rsi?
RSI key levels are crucial for traders. Levels above 70 signal overbought conditions, below 30 indicate oversold. High volatility assets may use 80/20 levels. Understanding RSI helps in predicting market trends and entry/exit points.
What Is the 5 Star RSI Strategy?
Do you want a strategy that combines RSI and price action effectively? The 5 Star RSI Strategy categorizes RSI into five levels to gauge trend strength or reversals, helping you make accurate trading decisions by filtering noise.
What Are the Important Points of Rsi?
When using RSI, remember values above 70 mean overbought, below 30 oversold. Crossing RSI lines suggests buys or sells. RSI predicts security performance, validates trends, and shows strength and reversals in bands.
Conclusion
You have now mastered the key steps to interpret RSI movements effectively.
Remember, overbought and oversold levels are crucial indicators, with 70 and 30 being commonly used thresholds.
An interesting statistic to note is that studies have shown that when RSI crosses above 70, there's a higher probability of a price reversal.
Keep analyzing RSI in conjunction with other indicators to make informed trading decisions.