
So, you want to navigate the complex world of technical trend indicators? Well, buckle up because understanding the basics is just the beginning.
These indicators aren't just lines on a chart; they hold the key to unlocking profitable trading strategies. From simple moving averages to complex oscillators, each indicator has a unique role in helping you decipher market trends.
But how do you know which indicator to choose or when to trust its signal? Let's unravel the mystery behind these fundamental tools and set you on the path to informed decision-making in the financial markets.
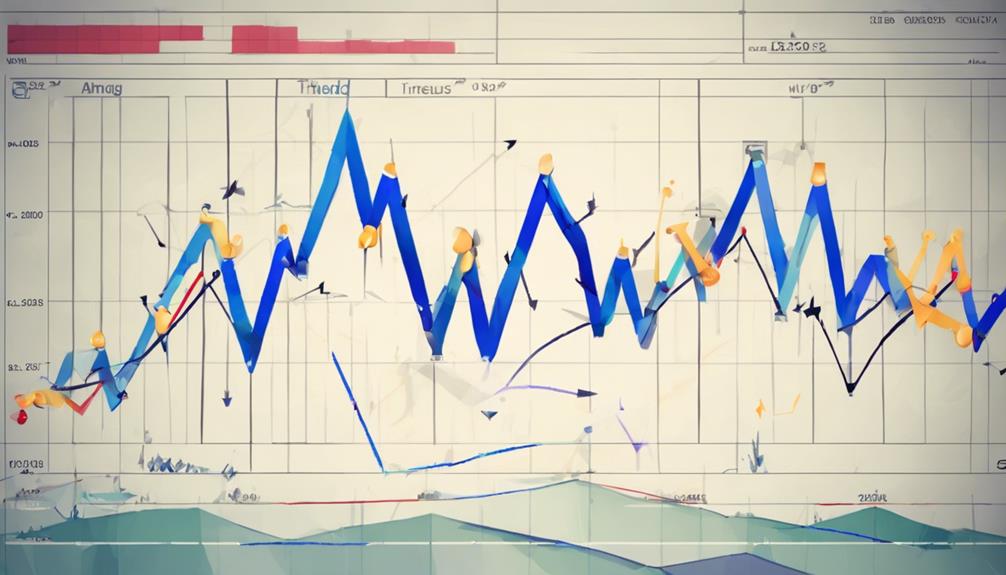
Types of Trend Indicators
When exploring the types of trend indicators, it's essential to understand the distinct characteristics and functions they offer in technical analysis.
Moving Average is a widely used indicator that smooths out price data to reveal trend direction.
Parabolic SAR helps identify potential reversal points by analyzing price momentum.
Average Directional Index (ADX) assesses trend strength, aiding traders in determining if the market is trending or moving within a range.
These indicators, such as Moving Average, Parabolic SAR, and ADX, are vital for recognizing and confirming market trends. They're integral to technical analysis, providing crucial insights into the direction and intensity of price movements.
Purpose of Trend Indicators
Trend indicators serve as essential tools for traders to accurately identify the prevailing direction of an asset's price movement. They play a crucial role in technical analysis by providing insights into the market trend, which helps traders make informed trading decisions. Here's why they're vital:
- Determining Market Trend: Trend indicators help traders identify whether an asset is in an uptrend, downtrend, or a ranging market.
- Assisting in Trading Decisions: By analyzing the signals provided by these indicators, traders can make better decisions on entering or exiting positions based on the identified trend.
- Utilizing Moving Averages: Moving averages are popular trend indicators that smooth out price data, making it easier for traders to identify the direction of the trend.
Common Trend Indicators
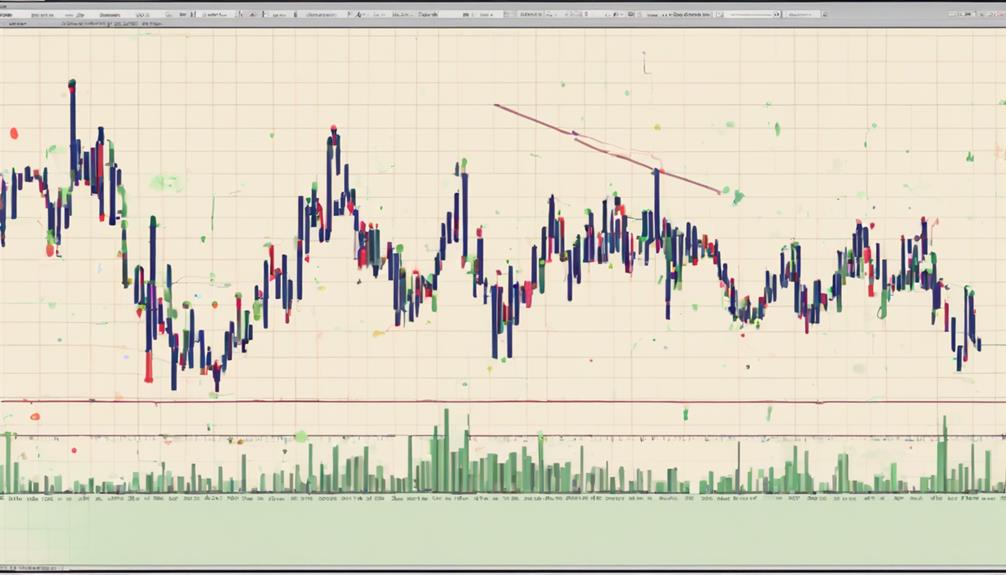
Among the various common trend indicators utilized by traders, Moving Average Convergence Divergence (MACD) stands out as a prominent tool for identifying shifts in a stock's momentum. Parabolic SAR is another significant indicator, offering potential reversal points in the market.
The Average Directional Index (ADX) helps gauge trend strength, distinguishing between trending and ranging markets. Additionally, moving averages like the 50-day and 200-day are effective at smoothing out price data over specific periods, aiding in trend identification.
MACD and Parabolic SAR serve as valuable tools for traders to determine both the direction and strength of market trends, while the ADX helps in assessing the power of prevailing trends. These indicators play a crucial role in guiding trading decisions based on market momentum and potential reversal points.
Interpreting Trend Indicators
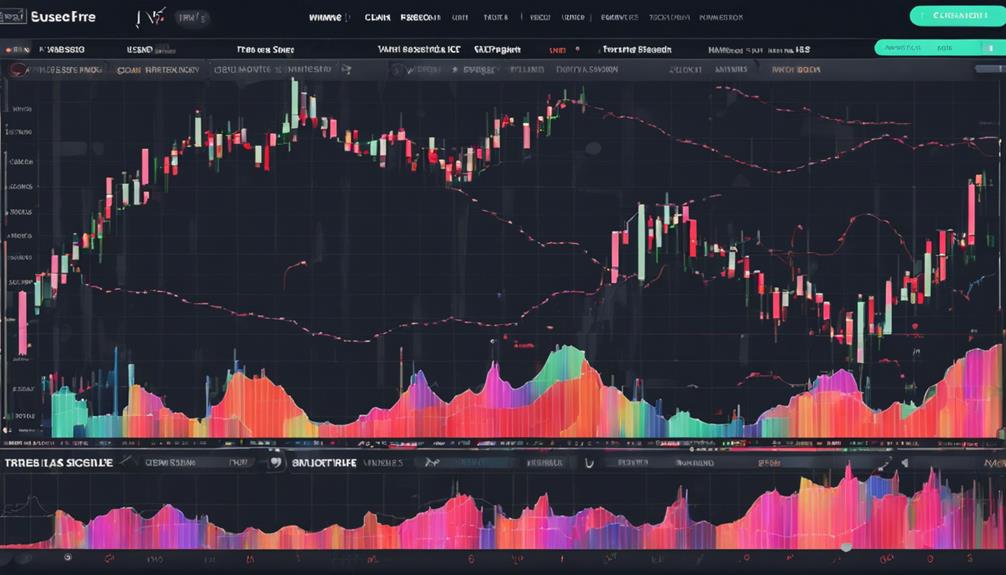
To effectively interpret trend indicators, analyze the slope and crossovers of the indicators to determine potential trend changes and entry or exit points in trading. When interpreting trend indicators like moving averages, Parabolic SAR, and Average Directional Index (ADX), consider the following:
- Analyzing Slope: Look at whether the indicator is sloping up, down, or flat to understand the momentum and potential strength of the trend.
- Crossovers: Pay attention to when the indicator lines cross each other or the price chart, as these points can signal potential changes in the trend direction.
- Staying in a Trade: Use trend indicators to help you stay in a trade as long as the trend remains intact, maximizing potential profits and minimizing losses.
Using Trend Indicators Effectively
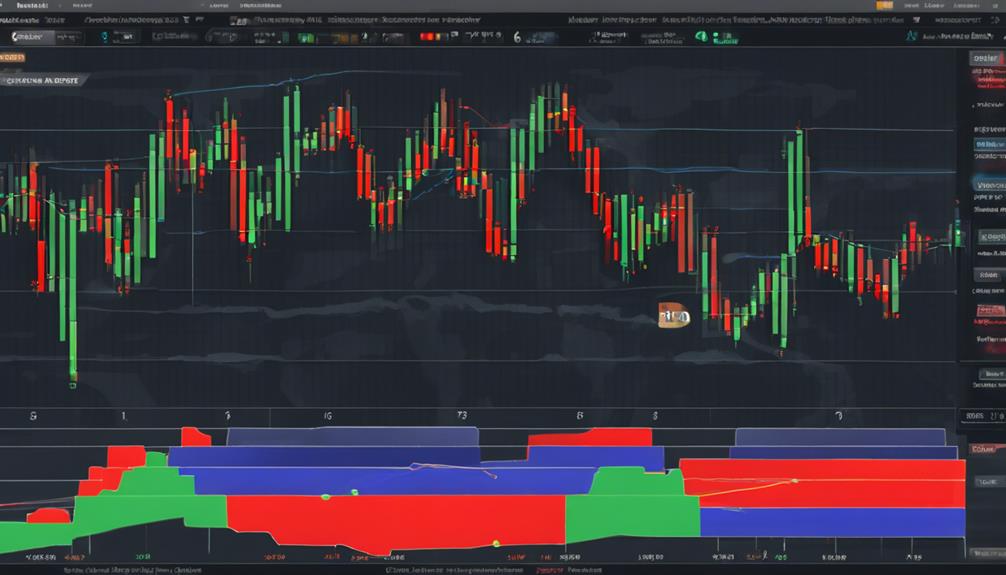
Effective utilization of trend indicators hinges on accurately interpreting historical price data to discern potential market trends and enhance decision-making processes in trading.
Technical indicators like moving averages and Parabolic SAR help identify market trends, support and resistance levels, and potential reversal points. Moving averages offer a smoothed trend line, aiding in recognizing trend strength and possible entry and exit points.
Parabolic SAR visually represents potential trend reversals through dots above or below price action. Utilize these indicators to confirm the strength of ongoing trends and spot opportunities for profitable trades.
Mastering the effective use of trend indicators can significantly improve your ability to navigate the market and make informed trading decisions.
How Do Technical Trend Indicators Help Beginners in Trading?
Technical trend indicators for beginners are essential tools in trading as they help identify market trends and potential entry and exit points. These indicators, such as moving averages and MACD, assist novice traders in making informed decisions and understanding the direction of the market movement.
Frequently Asked Questions
What Are the Basics of Technical Indicators?
Understand the basics of technical indicators for trading. They are mathematical tools analyzing price and volume data for market insights. Charts display trends, momentum, and potential price levels historically. Use them with other analysis methods.
What Are the Top 5 Technical Analysis Indicators?
Like a compass guiding a traveler, technical indicators navigate your trading journey. Moving Average, RSI, MACD, OBV, and Parabolic SAR offer insights into market trends, momentum, and potential reversals. Master them for successful trading.
What Are the Fundamentals of Technical Analysis?
When delving into technical analysis, you'll explore historical price and volume data to predict future movements. Focused on chart patterns and indicators, this method helps traders pinpoint entry and exit points effectively.
What Are the 4 Types of Indicators?
When looking at indicators, remember the four main types: trend, momentum, volatility, and volume. Each serves a unique purpose in analyzing stocks. Start by understanding these categories to navigate the market effectively.
Conclusion
In conclusion, understanding the fundamentals of technical trend indicators is crucial for successful trading. By utilizing various types of trend indicators and interpreting their signals effectively, you can make informed decisions to capitalize on market trends.
But remember, can you really afford to ignore the valuable insights these indicators provide?