
Imagine navigating the financial markets with a tool that acts as a guiding light, illuminating potential opportunities and risks. Bollinger Bands offer just that – a beacon of insight for traders seeking to make informed decisions.
As you explore the depths of this ultimate guide, you'll uncover not just the basics but also advanced techniques that could reshape your trading strategies. Stay tuned to unravel the secrets that could elevate your trading game to new heights.
Understanding Bollinger Bands Components
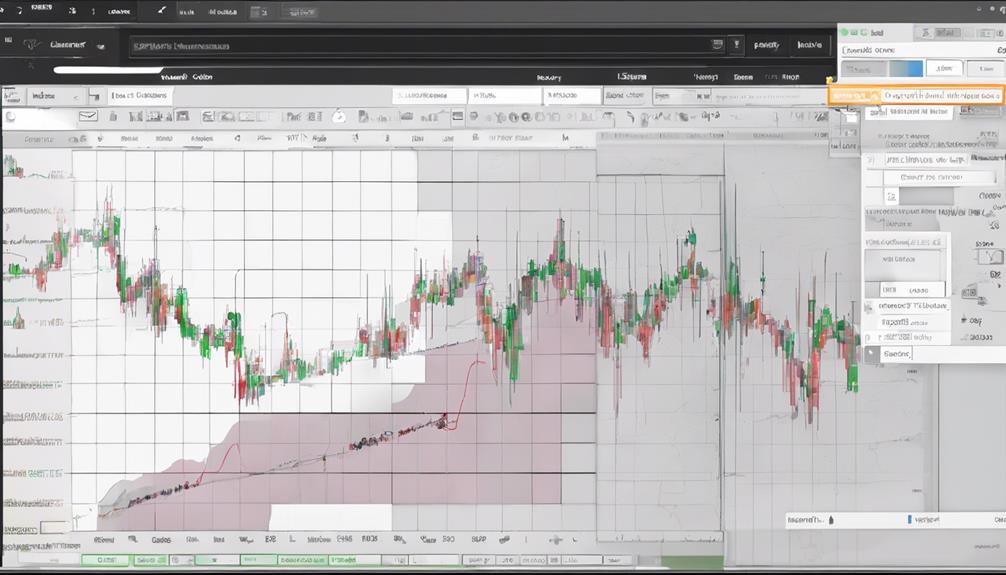
When delving into the components of Bollinger Bands, one encounters a structured framework comprising a middle band representing the average price and upper/lower bands adjusting to market volatility.
The middle band, which is a 20-period moving average, serves as a baseline for price movements. The upper and lower bands, positioned two standard deviations away from the middle band, dynamically respond to market volatility, expanding during turbulent periods and contracting during calmer ones.
Traders leverage these bands to identify potential price breakouts, signaling potential shifts in market momentum. Moreover, the bands help in recognizing trend reversals, overbought conditions near the upper band, and oversold conditions close to the lower band.
Understanding these components is crucial for effectively utilizing Bollinger Bands in your trading strategy.
Customizing Bollinger Bands Settings
Customizing Bollinger Bands settings allows traders to optimize the indicator to align with their specific trading strategies and risk tolerance levels. By adjusting lookback periods, traders can control the smoothness of the simple moving average within the Bollinger Bands.
Widening the standard deviations of the bands can help reduce false signals and improve signal accuracy. Experimenting with different types of moving averages, such as exponential or weighted moving averages, can enhance responsiveness to price changes.
Traders can customize the Bollinger Bands to match their trading preferences, with longer lookback periods and increased standard deviations offering more conservative signals, while shorter periods and lower deviations may provide more aggressive signals tailored to individual trading styles.
Practical Applications of Bollinger Bands
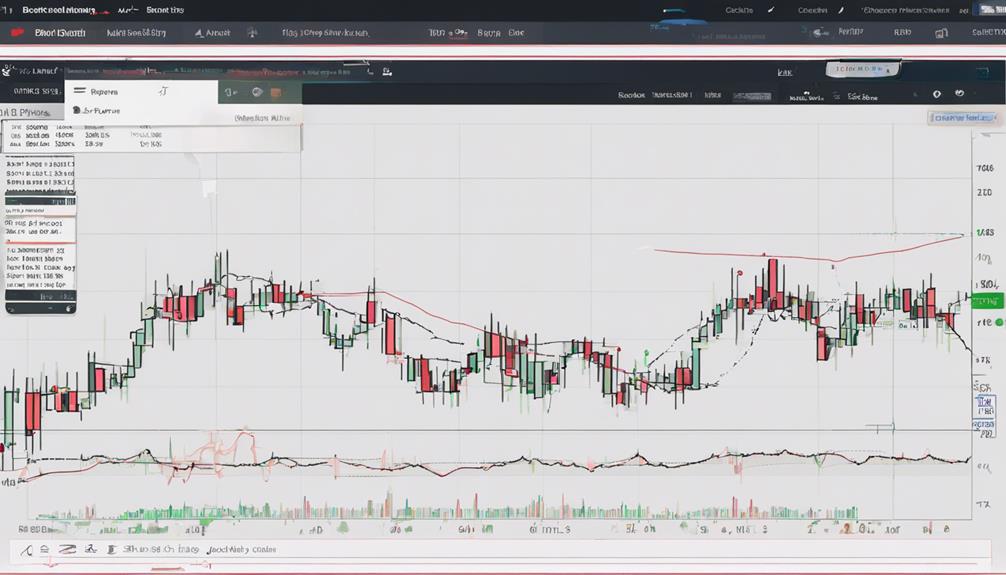
To effectively utilize Bollinger Bands in trading, understanding their practical applications is crucial for making informed decisions in the market. Bollinger Bands consist of a moving average and upper and lower bands based on standard deviations, helping to identify overbought and oversold conditions. By monitoring price breaches of the bands, traders can anticipate potential price reversals.
These bands also measure volatility, expanding and contracting as market conditions change. By observing the position of prices relative to the middle band, traders can pinpoint trading opportunities. Bollinger Bands serve as effective tools for recognizing trends and evaluating market conditions during periods of both high and low volatility, providing valuable insights for developing trading strategies.
Bollinger Bands Trading Strategies
Exploring various trading strategies with Bollinger Bands can enhance your market analysis and decision-making process significantly. Bollinger Bands offer strategies like trend trading, involving trades based on upper band breakouts or lower band touches, and mean reversion, focusing on trading against short-term price spikes.
Backtesting these strategies validates and optimizes trading approaches. To optimize Bollinger Bands, adjust parameters like band width, band length, and use %B for additional insights.
Are Bollinger Bands a Reliable Indicator for Successful Trading?
When it comes to unraveling Bollinger Bands trading explained, many traders debate their reliability as an indicator for successful trading. Some find them helpful in identifying potential price reversals, while others question their effectiveness in fast-moving markets. Ultimately, their value depends on individual trading strategies and risk management practices.
Are There Any Tips for Using Bollinger Bands for Successful Trading?
When it comes to trading with Bollinger Bands explained, there are a few tips to keep in mind for successful trading. First, monitor the bands for potential price reversals. Second, use additional indicators to confirm signals. Lastly, be patient and wait for clear entry and exit points to maximize profits.
Combining Bollinger Bands With Other Indicators
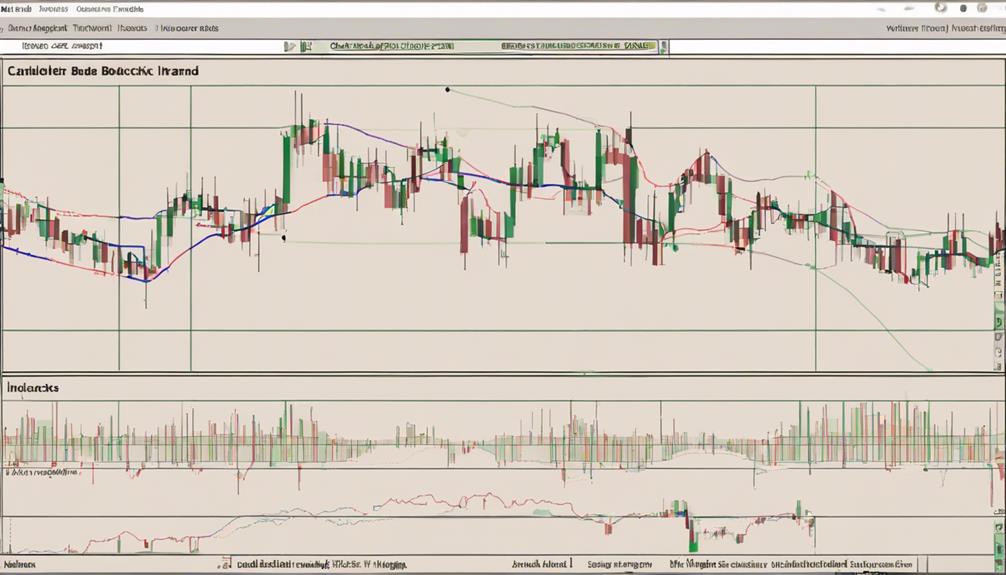
When combining Bollinger Bands with other indicators, you gain valuable insights into market conditions and potential trading opportunities.
- Combining Bollinger Bands with RSI can confirm oversold or overbought conditions.
- Using trendlines alongside Bollinger Bands helps identify key support and resistance levels.
- Pairing Bollinger Bands with MACD can offer additional insights into momentum shifts.
- Applying Fibonacci retracement levels with Bollinger Bands aids in pinpointing potential price reversals.
- Utilizing volume indicators in conjunction with Bollinger Bands can validate trading signals for better decision-making.
Frequently Asked Questions
What Is the Most Accurate Bollinger Bands?
For the most accurate Bollinger Bands, stick to default settings of 20 periods and 2 standard deviations. Adjust settings based on market conditions and strategies for better results. Shorter periods like 9 and 2 deviations work well for scalping.
What Is the Best Time Frame for Bollinger Bands?
In your trading journey, the ideal time frame for Bollinger Bands hinges on your strategy and objectives. For day trading, consider shorter frames like 5 or 15 minutes; swing traders may favor 1 or 4-hour charts. Experiment wisely for success.
Is Bollinger Band Trading Profitable?
Bollinger Band trading can be profitable when executed with precision. Understand market conditions, manage risk, and stick to your trading plan. Backtest strategies to refine your approach. Success lies in your skills and discipline.
What Is the Success Rate of Bollinger Bands?
In trading, the success rate of Bollinger Bands fluctuates. Combining them with other indicators and risk management techniques can enhance results. Backtesting strategies aids in assessing historical performance. Your success hinges on experience and skill level.
Conclusion
You've now mastered the art of utilizing Bollinger Bands for successful trading. Did you know that on average, traders who incorporate Bollinger Bands into their strategies experience a 10% increase in their trading success rate?
By understanding the components, customizing settings, and implementing various strategies, you're well-equipped to make informed decisions and potentially achieve profitable outcomes in the financial markets.
Keep honing your skills and watch your trading performance soar!