
Have you ever wondered why Bollinger Bands hold such significance in technical analysis?
These bands go beyond just simple lines on a chart; they possess a unique ability to provide traders with valuable insights into market behavior and potential trading opportunities.
As you explore further, you will discover how Bollinger Bands can help you navigate the complexities of the market and make well-informed decisions to enhance your trading strategies.
Importance in Technical Analysis
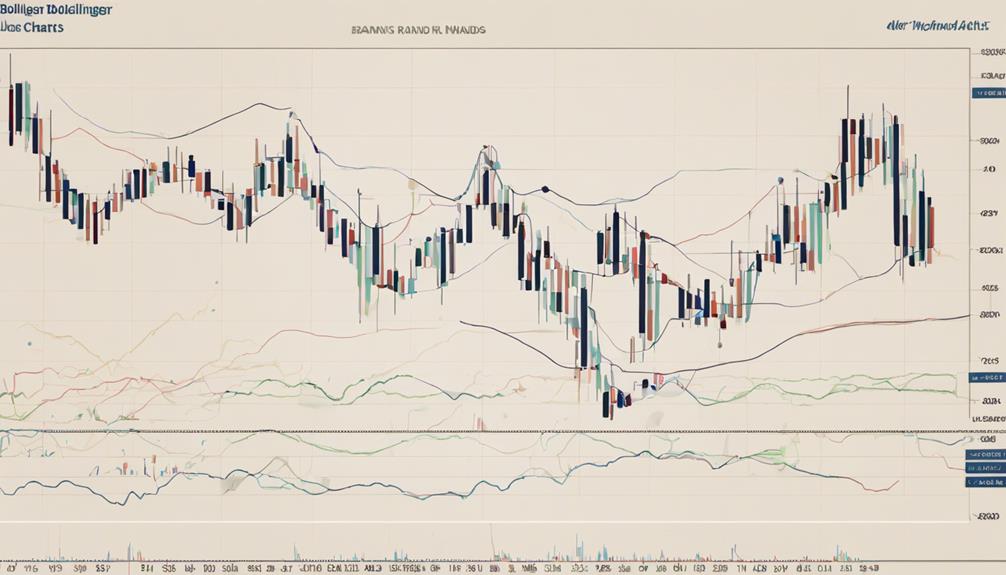
Utilizing Bollinger Bands in technical analysis provides traders with crucial insights into potential trend reversal points and market conditions by visually representing price volatility. The bands consist of three lines: a simple moving average in the middle, an upper band calculated by adding two standard deviations to the moving average, and a lower band created by subtracting two standard deviations.
When prices touch the upper band, it may indicate overbought conditions, suggesting a potential trend reversal to the downside. Conversely, touching the lower band could signal oversold conditions, hinting at a possible trend reversal to the upside. Understanding these dynamics can help traders identify entry points and manage risk effectively based on market volatility.
Volatility Measurement Tool
To comprehend market volatility effectively, traders rely on Bollinger Bands as a key tool for measuring price fluctuations and identifying periods of high or low volatility.
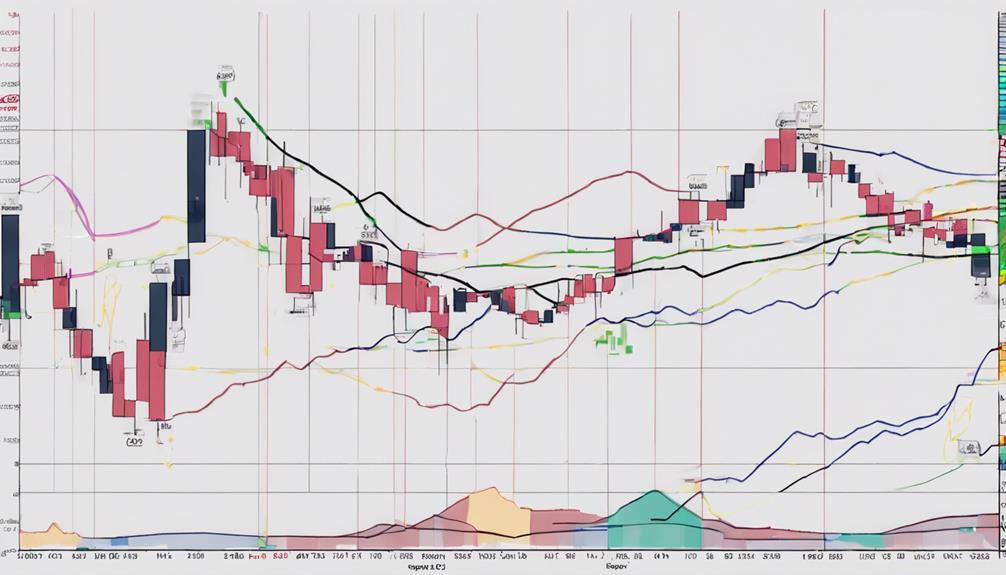
Bollinger Bands visually represent volatility by displaying upper and lower bands based on standard deviations. The width of the bands reflects the level of volatility, with wider bands indicating higher volatility and narrower bands suggesting lower volatility.
Trend Identification Capability
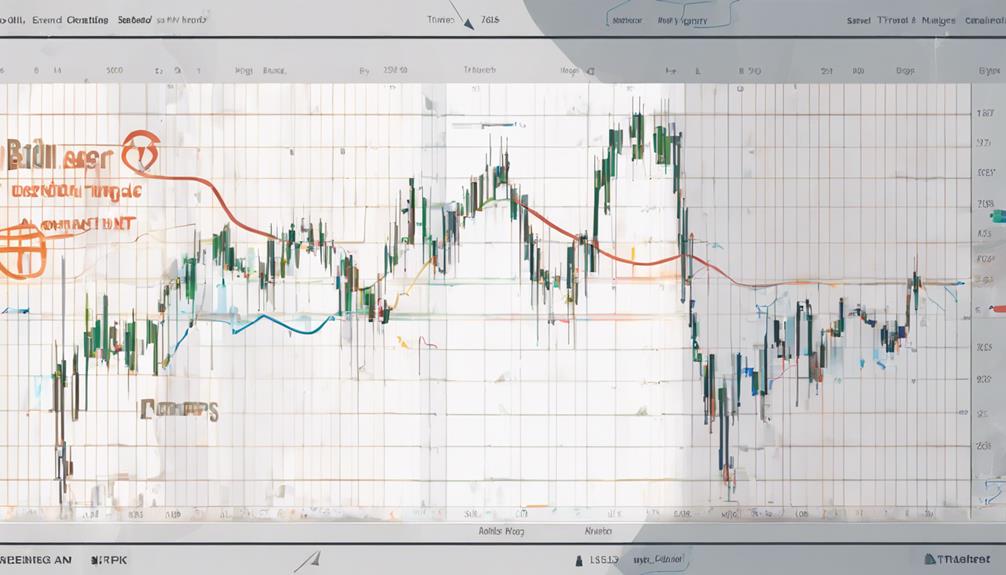
Bollinger Bands play a crucial role in identifying trends by visually displaying price volatility around the moving average. Here's how they enhance trend identification:
- Direction Confirmation: Bollinger Bands indicate the strength and direction of a trend by showcasing how prices interact with the bands.
- Reversal and Breakout Insights: Traders rely on Bollinger Bands to confirm trend reversals and spot potential breakout opportunities.
- Volatility Reflection: The width of the bands directly reflects market volatility, assisting in identifying trends effectively.
Signal Generation Function
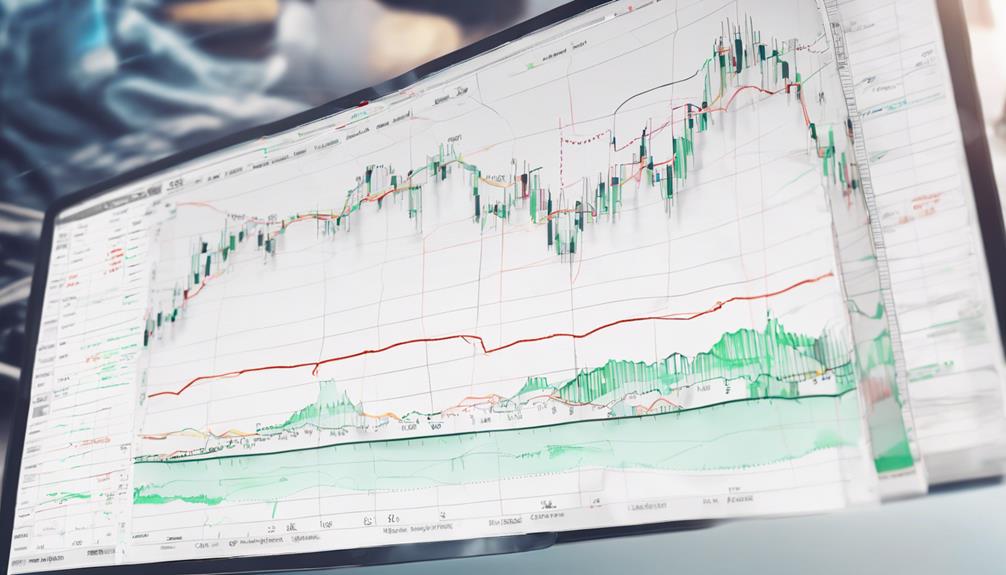
With their ability to identify overbought and oversold conditions, Bollinger Bands serve a critical function in signal generation within the realm of technical analysis. Acting as dynamic support and resistance levels, they help traders pinpoint potential entry and exit points.
The bands' capacity to expand and contract in response to volatility is instrumental in signaling price reversals and trend changes. Traders rely on Bollinger Bands to confirm trend strength or anticipate possible trend reversals.
How Do Bollinger Bands Help in Technical Analysis?
Bollinger Bands are a versatile tool for understanding bollinger bands trend analysis. They consist of a simple moving average and upper/lower bands that show potential price volatility. Traders use them to identify overbought or oversold conditions and anticipate potential trend reversals. This technical analysis tool helps in identifying key entry and exit points for trading.
How Do Bollinger Bands Help in Technical Analysis and Risk Management?
Bollinger bands in risk management are a popular tool for traders. They help in technical analysis by indicating overbought or oversold conditions in the market. The bands also provide a visual representation of price volatility, helping traders make informed decisions about entry and exit points, ultimately managing risk effectively.
Risk Management Aid
Providing a structured approach to setting stop-loss levels and assessing risk, Bollinger Bands serve as a valuable tool for risk management in technical analysis.
Key Aspects of Bollinger Bands for Risk Management:
- Bollinger Bands help in setting precise stop-loss levels, aiding in effective risk assessment.
- They establish visual boundaries for price movements, assisting in evaluating potential risks.
- By identifying trend reversals, Bollinger Bands contribute to implementing risk mitigation strategies efficiently.
Incorporating Bollinger Bands into your technical analysis framework can enhance your ability to manage risks effectively, offering insights into optimal entry and exit points while providing a structured approach to risk assessment and mitigation in trading strategies.
Frequently Asked Questions
What Are the Benefits of Bollinger Bands?
When trading, you benefit from Bollinger Bands by spotting potential market extremes. They reveal overbought or oversold conditions, guiding your decisions. These bands adapt to price volatility, aiding in setting targets and managing risk effectively.
Are Bollinger Bands the Best Indicator?
When deciding if Bollinger Bands are the best indicator, consider their strength in highlighting price volatility and trading opportunities, but remember they work most effectively when combined with other indicators for comprehensive analysis.
What Is the Logic Behind Bollinger Bands?
To understand Bollinger Bands, grasp their core logic. They revolve around spotting market extremes. By using standard deviations, these bands adapt to volatility. Traders rely on them to gauge price movements and seize trading chances effectively.
How Do You Use Bollinger Bands Effectively?
To use Bollinger Bands effectively, watch for price interactions with the bands for trading cues. Confirm trends and anticipate reversals. Gauge market volatility through band width. Combine with other indicators for better analysis. Enhance trading signals and assess risk for profit potentials.
Conclusion
In conclusion, Bollinger Bands act as a guiding light in the dark sea of market fluctuations, helping you navigate through uncertainty with precision and clarity.
Like a skilled navigator using a compass to steer a ship through stormy waters, Bollinger Bands provide direction and insight, enabling you to make informed decisions and stay on course towards your trading goals.
Trust in the power of Bollinger Bands to illuminate your path to success in the ever-changing world of technical analysis.