
Standard deviation serves as a cornerstone in trading methodologies, providing traders with essential data on market volatility and risk factors. Understanding how standard deviation applications can impact trading strategies is paramount to navigating the complexities of financial markets successfully.
From market evaluation to implementing risk management techniques, standard deviation offers a diverse range of applications that can significantly enhance a trader's decision-making process. By exploring the seven best applications of standard deviation in trading, one can uncover valuable insights that may potentially revolutionize their approach to market analysis and trading execution.
Market Evaluation With Standard Deviation
When evaluating markets using standard deviation, traders can effectively gauge price volatility by quantifying the dispersion of asset prices from the mean average. Standard deviation serves as a crucial measure in trading, providing insights into the level of risk associated with market behavior. By analyzing historical data through standard deviation, traders can assess the degree of price swings and potential trading opportunities or risks present in the market.
The use of standard deviation in market evaluation enables traders to comprehend the variability in prices over time, aiding in decision-making processes and risk management strategies. High standard deviation values indicate increased market risk, signaling the likelihood of significant price fluctuations. Understanding market behavior through standard deviation allows traders to navigate periods of uncertainty and stability, enhancing their ability to make informed trading decisions. By incorporating standard deviation into their analytical toolkit, traders can better grasp the dynamics of price movements and adjust their trading strategies accordingly to capitalize on market opportunities while mitigating risks.
Calculating Standard Deviation Formula

The calculation of the standard deviation formula plays a critical role in quantifying price volatility and assessing market momentum for traders. To calculate standard deviation effectively, traders typically follow these steps:
- Find the mean average closing price of the asset.
- Determine the deviations of each period's closing price from the mean average.
- Square these deviations, sum them up, and divide by the number of periods to obtain the variance.
Standard deviation helps measure the variation of prices relative to the mean average, providing valuable insights into historical volatility and market momentum. This formula is a fundamental tool in risk management, enabling traders to quantify price volatility accurately and make informed decisions regarding their positions.
Understanding the standard deviation formula is crucial for traders to analyze market behavior effectively, establish realistic price targets, and enhance overall trading strategies.
Risk Assessment Strategies

Utilizing standard deviation as a fundamental risk assessment tool in trading allows traders to evaluate price volatility, optimize risk management strategies, and make informed decisions regarding position sizing and market entry points.
Standard deviation aids in calculating risk vs. return ratios, determining optimal stop-loss and take-profit levels, and assessing the volatility of different assets for effective portfolio diversification and risk management.
By analyzing historical standard deviation data, traders can allocate risk efficiently and decide on appropriate position sizes within their trading strategies. This approach also helps in evaluating market momentum and identifying entry and exit points based on calculated risk levels.
Implementing standard deviation in risk assessment strategies enables traders to set realistic price targets, manage risk effectively, and enhance decision-making processes in various trading scenarios.
Diversification Techniques
Diversification techniques play a crucial role in portfolio management by spreading investments across various asset classes to mitigate overall risk. This strategy aims to create a balanced portfolio that optimizes the allocation of assets with different levels of risk. By diversifying across asset classes, investors can reduce the impact of volatility in any single asset on the entire portfolio's performance.
Utilizing standard deviation as a measure of volatility within each asset class helps in assessing and managing risk effectively. Analyzing standard deviation across different asset classes enables investors to optimize their portfolio allocation, ensuring a diversified mix that aligns with their desired risk-return profile.
- Diversification spreads investments to minimize risk exposure.
- Standard deviation measures volatility within asset classes.
- Balanced portfolio allocation across different asset classes optimizes risk management.
Volatility Analysis Methods
Volatility analysis methods play a crucial role in trading strategies by providing insights into market dynamics.
Techniques such as volatility measurement, historical price analysis, and implied volatility evaluation are essential for understanding asset price fluctuations.
Utilizing these methods allows traders to make informed decisions, manage risk effectively, and optimize their trading approaches.
Volatility Measurement Techniques
One of the fundamental aspects of market analysis involves employing quantitative techniques, such as Standard Deviation, to evaluate the level of price fluctuation within a given asset or market.
- Standard Deviation helps measure volatility and assess the degree of price fluctuations.
- It provides insights into the risk associated with an asset or market.
- Historical price data analyzed through Standard Deviation aids in forecasting future volatility.
These techniques are crucial for traders to manage risk effectively, determine appropriate position sizing, and develop sound trading strategies based on a thorough understanding of market conditions.
Historical Price Analysis
Utilizing historical price data through standard deviation analysis serves as a pivotal tool for traders seeking to grasp the intricate dynamics of market volatility and make informed decisions based on calculated risk assessments.
Historical price analysis, utilizing standard deviation for volatility assessment, helps traders understand the variability of asset prices and market dynamics. By calculating standard deviation from past price movements, traders can anticipate risk levels and fluctuations in asset prices. This information aids in risk management, providing insights into the range of price movements and enabling traders to adjust their strategies accordingly.
Understanding historical price volatility through standard deviation allows for setting realistic targets and adapting risk parameters to navigate market uncertainties effectively.
Implied Volatility Evaluation
Implied volatility evaluation, a critical component of volatility analysis methods, provides traders with essential insights into market sentiment and potential price movements based on options prices.
- Implied volatility reflects market expectations
- Helps in managing risk by understanding risk perception and uncertainty levels
- Guides traders in identifying opportunities for profitable options trading strategies.
Analyzing implied volatility is paramount for traders seeking to make well-informed decisions in the options market. By interpreting implied volatility data, traders can better comprehend the underlying market sentiment, foresee potential price fluctuations, and adapt their strategies to the prevailing risk levels. This evaluation serves as a cornerstone for effectively managing risk exposure and capitalizing on opportunities presented by dynamic market conditions.
Stop Loss and Take Profit Approaches
Standard deviation serves as a crucial tool in setting stop-loss and take-profit orders. It enables traders to manage risk effectively by accounting for price fluctuations and asset volatility. By aligning take-profit targets with historical price variability, traders can establish profit goals grounded in data-driven analysis.
Utilizing standard deviation allows for the adjustment of stop-loss and take-profit levels to adapt to changing market conditions. This enhances risk management strategies and potentially improves trading outcomes.
Risk Management Strategies
Risk management strategies in trading, particularly through the use of stop loss and take profit approaches based on standard deviation, play a crucial role in minimizing potential losses and maximizing profits for traders. Standard deviation aids in determining the optimal stop loss and take profit levels by considering historical volatility and price fluctuations. Implementing these strategies helps traders manage risk effectively and maintain discipline in their trading approach. By incorporating standard deviation into risk management strategies, traders can enhance their overall trading performance and protect their capital from unexpected market movements.
- Setting stop loss orders based on standard deviation
- Utilizing take profit approaches using standard deviation
- Enhancing risk management strategies with standard deviation
Volatility-Based Exit Plans
When devising exit plans in trading strategies, a focus on volatility-based approaches proves essential for effectively managing risk and optimizing profit potential. Utilizing standard deviation for stop-loss orders allows traders to set exit points based on asset price volatility, enabling efficient risk management.
Take profit approaches incorporating standard deviation help define profit targets by analyzing historical price fluctuations and volatility levels. By integrating standard deviation into exit plans, traders can establish optimal entry and exit points aligned with asset price movements.
This method assists in determining appropriate stop-loss levels by considering price variability and market volatility, ultimately enhancing overall risk management within trading strategies.
Bollinger Bands Utilization
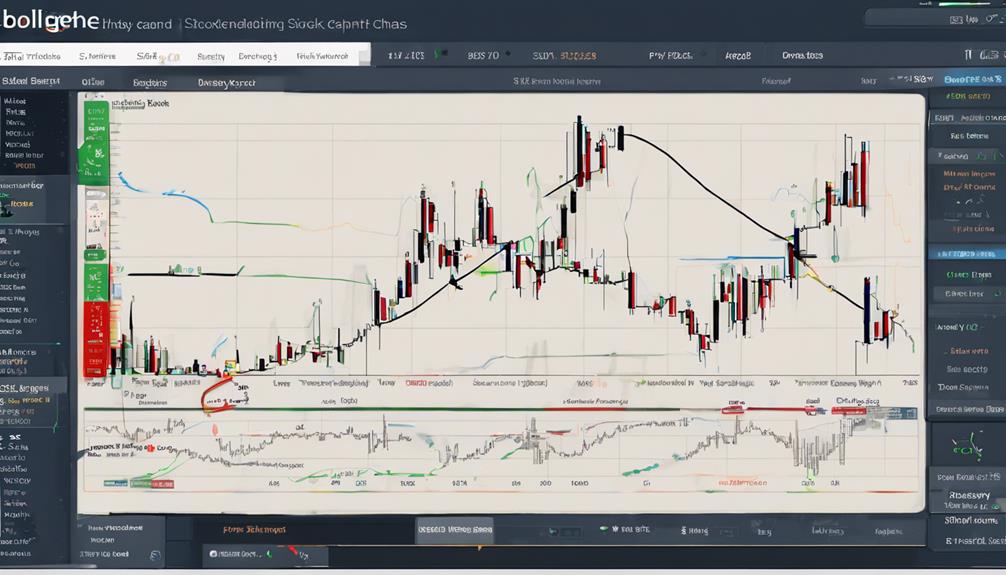
Utilizing Bollinger Bands in trading provides traders with a versatile tool for analyzing market conditions and making informed decisions based on price volatility. Bollinger Bands, consisting of a simple moving average and two standard deviation bands, offer various advantages in shaping a robust trading strategy.
Here are three key aspects of Bollinger Bands utilization:
- Identification of Overbought and Oversold Levels: Bollinger Bands help traders recognize overbought conditions when prices touch the upper band and oversold situations when they hit the lower band.
- Detection of Trend Reversals: Traders use Bollinger Bands to anticipate potential trend reversals as prices often revert to the mean after touching the bands.
- Setting Profit Targets and Stop-loss Levels: The bands' support and resistance levels aid in establishing effective profit targets and stop-loss levels, enhancing risk management within a trade.
What are the practical applications of standard deviation in trading?
Standard deviation is a critical tool in trading. It measures the volatility of an investment’s returns. By understanding the advantages of standard deviation, traders can assess risk and make informed decisions. It helps in comparing the performance of different stocks and determining the reliability of their returns.
Frequently Asked Questions
What Are 3 Real World Applications of Standard Deviation?
Standard deviation is widely applied in risk assessment, quality control, and survey analysis. It measures data dispersion, aids in decision-making, and guides statistical analysis. This statistical tool is fundamental across various fields for its reliability and versatility.
How Do You Use Standard Deviation in Trading?
In trading, standard deviation is utilized to evaluate historical volatility, assess risk exposure, set price targets, manage stop-loss orders, and pinpoint entry/exit levels. It aids in understanding market momentum, asset volatility, and making informed trading decisions.
What Standard Deviation Is Good for Stocks?
A good standard deviation for stocks depends on the investor's risk tolerance and investment goals. Lower standard deviation signifies less volatility and risk, appealing to conservative investors. Higher standard deviation indicates higher risk and potential returns, suited for aggressive traders seeking growth opportunities.
What Is the Application of Standard Deviation in Investment?
Standard deviation in investment serves as a critical tool for assessing asset volatility, managing risk, and determining price movements. It aids in setting stop-loss orders, evaluating market momentum, and improving trading strategies by incorporating volatility measurements effectively.
Conclusion
In the realm of trading, standard deviation serves as a compass guiding investors through the turbulent seas of market volatility. Like a skilled navigator, it provides valuable insights into risk management, market evaluation, and decision-making processes.
However, caution must be exercised when relying solely on standard deviation, as its limitations may obscure the true path ahead in times of uncertainty. In the ever-changing landscape of trading, standard deviation remains a powerful tool, but one that requires a discerning eye to navigate effectively.