
The Fast Track Guide to Average Directional Index presents a structured approach to navigating the complexities of trend analysis in trading. Understanding the nuances of ADX can significantly impact decision-making processes, offering traders a competitive edge in volatile markets.
By exploring the intricacies of ADX and its practical applications, traders can unlock a wealth of insights that go beyond basic trend identification. This guide serves as a gateway to a deeper understanding of how ADX can be leveraged to refine trading strategies and adapt to evolving market conditions, making it an essential tool for traders seeking sustainable success in the financial markets.
ADX Definition and Key Takeaways
The Average Directional Index (ADX) is a technical indicator created by J. Welles Wilder to evaluate trend strength in financial markets efficiently. It is a crucial tool for traders as it helps in assessing the strength of trends.
The ADX consists of three components: the ADX line, +DI (Positive Directional Indicator), and -DI (Negative Directional Indicator). These components work together to provide signals about the strength of a trend.
ADX values typically range from 0 to 100, with higher values indicating stronger trends. Traders use specific ADX levels to determine whether a market is trending or ranging.
ADX Formula and Interpretation
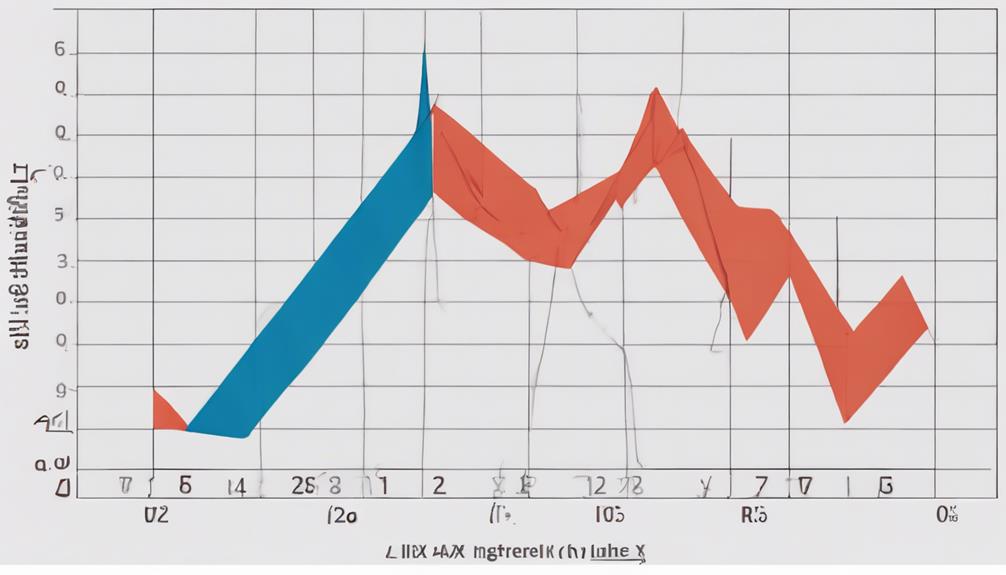
When calculating the Average Directional Index (ADX), traders compute the 14-period smoothed average of true range values and directional movement indicators. The ADX formula results in values ranging from 0 to 100, with readings above 25 typically indicating increasing trend strength. Traders interpret ADX values based on thresholds such as 20 for a weak trend, 25-50 for a moderate trend, and above 50 for a strong trend.
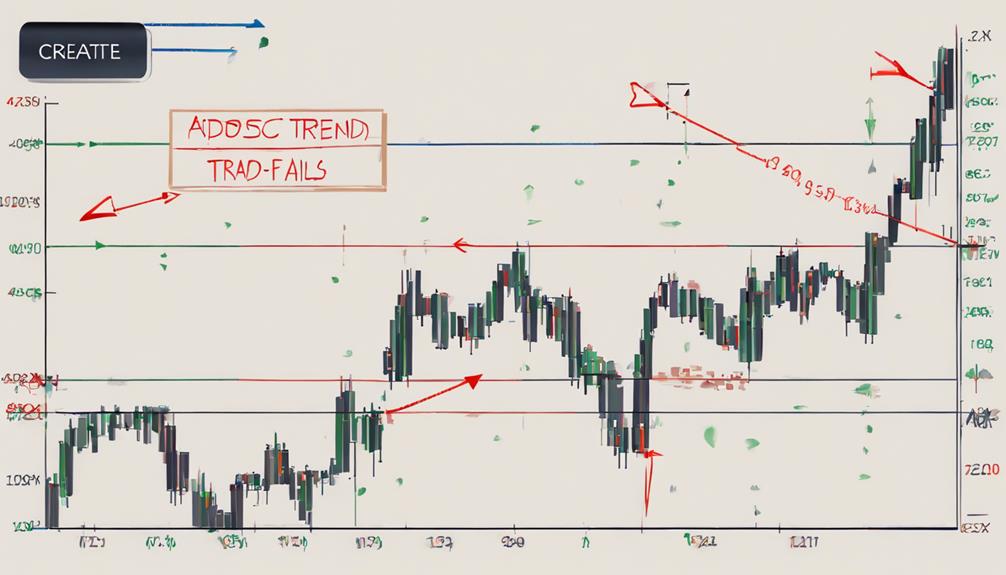
It is essential to note that while ADX provides insights into trend strength, it does not offer information on price direction. Instead, it focuses on the intensity and power of market trends. By monitoring ADX crossovers and trendline movements, traders can identify potential changes in trend strength, aiding in decision-making processes.
Utilizing ADX in conjunction with other technical indicators like the Moving Average Convergence Divergence (MACD) can enhance trend analysis and help traders make informed market decisions based on the prevailing trend strength.
Utilizing ADX in Trading Strategies
Utilizing ADX in trading strategies involves analyzing trend strength to inform strategic entry and exit decisions. By incorporating the Average Directional Index (ADX) into trading strategies, traders can gauge the strength of a trend, helping them determine potential entry points during strong trends and exit points during weakening trends. ADX can also be used in conjunction with other indicators to confirm trends and enhance trading signals. Paying attention to ADX crossovers between the positive and negative directional indicators can provide valuable insights into market dynamics.
Moreover, adjusting the period for ADX calculations allows for flexibility in adapting to various market conditions and time frames. A rising ADX value indicates increasing trend strength, which can influence trading decisions and risk management practices. Traders can utilize ADX not only for trend analysis but also for assessing the intensity of a trend, thereby improving the overall effectiveness of their trading strategies.
Enhancing Trading With ADX and Other Indicators
Enhancing trading effectiveness through the strategic integration of the Average Directional Index (ADX) and complementary indicators can significantly improve trend analysis accuracy and signal confirmation. By combining ADX with Moving Averages, traders can gain a better understanding of the prevailing trend's strength and direction.
Additionally, utilizing ADX crossovers with indicators like Relative Strength Index (RSI) can offer robust confirmation signals for potential trading opportunities. Incorporating ADX alongside Volume indicators helps traders validate trend strength and identify possible reversals, enhancing decision-making processes.
Furthermore, integrating ADX into Fibonacci retracement analysis can enhance precision in determining optimal entry and exit points based on trend movements. When used in conjunction with Bollinger Bands, ADX becomes a valuable tool for pinpointing potential trend reversals and breakouts, providing traders with a comprehensive view of market dynamics and improving overall trading strategies.
This strategic amalgamation of ADX with various indicators can offer a holistic approach to trend analysis and signal validation, empowering traders to make more informed and effective trading decisions.
ADX Success and Pitfalls
The evaluation of ADX success and pitfalls is crucial for traders seeking to optimize trend analysis and minimize risks in their trading strategies. When delving into the nuances of Average Directional Index (ADX) values, traders can uncover both the keys to success and potential pitfalls:
- ADX success is often indicated by values above 40, signifying a strong trend in the market.
- Pitfalls may arise as ADX has a tendency to lag behind price movements, potentially leading to missed opportunities.
- False signals can be prevalent in choppy markets when ADX values fall below 25, impacting trading decisions.
- Successful utilization of ADX involves combining it with other indicators to confirm trends and minimize risks effectively.
- Understanding the intricacies of ADX values is paramount for traders to navigate through the complexities of the market, avoid pitfalls, and maximize trading effectiveness.
How Can I Use the Average Directional Index to Improve My Skills?
Mastering the use of the Average Directional Index (ADX) may seem daunting, but fear not! Here are some essential tips to excel with the average directional index. Firstly, understand the ADX’s purpose as a trend strength indicator. Next, make use of its values to identify potential trend reversals accurately. Lastly, combine the ADX with other technical analysis tools for a comprehensive trading strategy. With these tips, you can effectively improve your skills and navigate the markets like a pro.
Frequently Asked Questions
What Are the Best Settings for the Average Directional Index?
The optimal settings for the Average Directional Index (ADX) are typically around a standard period of 14, as suggested by J. Welles Wilder. Traders may adjust these settings based on market conditions, with common variations including 10 or 20 periods.
How Do You Calculate Average Directional Index?
To calculate the Average Directional Index (ADX), combine smoothed True Range, Plus Directional Movement, and Minus Directional Movement values. Calculate Directional Movement Index (DX) from +DI and -DI, then average DX values over a specified period to determine trend strength accurately.
What Are the Best Intraday Settings for Adx?
For intraday trading, optimal ADX settings involve a 14-period configuration, reflecting trend strength accurately. In volatile markets, shorter periods like 10 or 7 can provide swift signals. Combining a 14-period ADX with shorter periods for directional indicators aids in confirming trend direction effectively.
What Is the Best Indicator to Combine With Adx?
Combining the Average Directional Index (ADX) with the Moving Average Convergence Divergence (MACD) is highly effective for trend analysis. This pairing provides a comprehensive view of both trend strength and momentum, enhancing decision-making in trading strategies.
Conclusion
In conclusion, the Average Directional Index (ADX) serves as a powerful tool for traders to assess trend strength and potential changes in the market. By incorporating ADX into trading strategies alongside other indicators, traders can enhance their decision-making process and effectively manage risk.
However, it is important to acknowledge the limitations and pitfalls of relying solely on ADX for trading decisions. Ultimately, a comprehensive approach using multiple indicators can lead to more informed and successful trading outcomes.