
The ROC Indicator stands as a crucial tool in the arsenal of swing traders, offering valuable insights into market momentum and strength. By comparing recent closing prices with previous ones, this indicator allows traders to gauge the market's vigor and potential opportunities.
With its ability to highlight robust markets and aid in effective market selection, the ROC Indicator serves as a cornerstone for informed trading decisions. However, its significance extends beyond mere market selection.
As we explore further, the intricate nuances of implementing the ROC Indicator in swing trading reveal a world of possibilities for traders seeking to enhance their strategies and performance.
Understanding the ROC Indicator
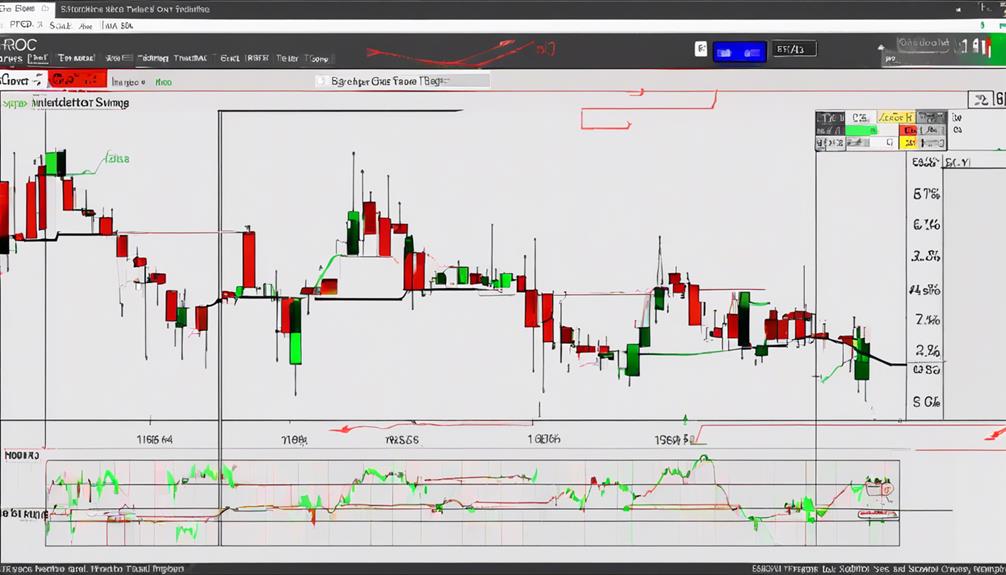
In the realm of swing trading, a foundational concept that traders must grasp is the comprehensive understanding of the Rate of Change (ROC) indicator and its implications on market dynamics. The ROC indicator measures the rate of change in the price of a security over a specified period, highlighting the speed at which prices are moving. By calculating the percentage difference between the current price and a previous price, the ROC indicator offers insights into momentum shifts and trend strength. It oscillates around a zero-level midpoint, with values above zero indicating positive momentum and values below zero signaling negative momentum.
While the ROC indicator is not primarily used for timing entries or trend identification, it serves as a valuable tool for selecting markets with stronger momentum. Understanding the ROC indicator is crucial for assessing market changes over specific periods and identifying potential trading opportunities in swing trading. Traders can leverage this indicator to evaluate market strength and make informed decisions when selecting markets for swing trading strategies.
Implementing ROC Indicator in Swing Trading
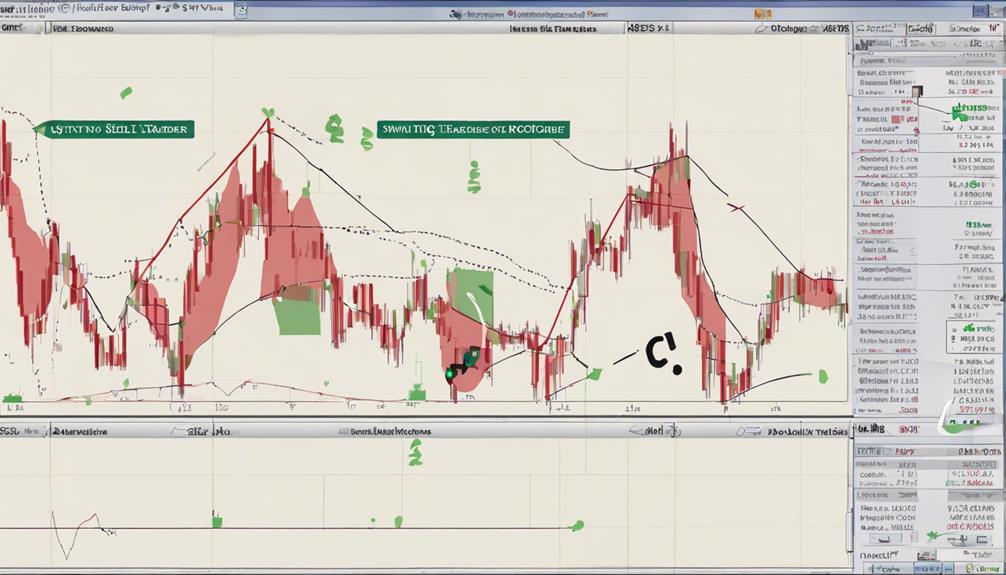
Utilizing the ROC indicator in swing trading provides traders with a strategic tool to analyze momentum shifts and make informed decisions based on price movements.
- Implementing ROC indicator allows traders to gauge momentum shifts effectively.
- ROC aids in identifying potential entry and exit points in swing trading.
- It helps capture short to medium-term trends by analyzing price movements.
- Monitoring ROC values assists in evaluating the strength of price movements.
- Integrating ROC in strategies enhances decision-making processes for executing profitable trades.
Identifying Stock Opportunities With ROC
How can the ROC indicator aid traders in identifying stock opportunities with the strongest momentum?
The Rate of Change (ROC) indicator is a valuable momentum-based indicator that compares the current closing price of a stock to its past closing price, providing insights into stock momentum.
By ranking stocks based on their ROC values, traders can pinpoint high-potential stocks that exhibit positive ROC values, indicating upward price momentum and bullish sentiment.
This filtering mechanism allows traders to focus on stocks with robust momentum, enhancing the likelihood of successful trades in swing trading strategies.
Utilizing ROC values in stock selection is crucial for identifying opportunities with the most favorable momentum characteristics, ultimately improving trading outcomes.
ROC Indicator for Forex Pair Selection
When assessing forex pair selection, the ROC indicator plays a pivotal role in ranking currencies based on their rate of change values. This momentum-based indicator assists traders in identifying the strongest and weakest currencies, facilitating informed trading decisions.
Utilizing the ROC Trading Strategy involves matching strong and weak currencies based on their ROC values to select appropriate forex pairs. This quantitative approach provided by the ROC indicator enhances decision-making processes in the forex market, offering a data-driven method for traders to evaluate potential opportunities.
Evaluating the Effectiveness of ROC
The evaluation of ROC effectiveness in swing trading involves conducting backtests on various trading strategies utilizing different ROC parameters to assess their performance across diverse market conditions. By analyzing historical data, traders can determine how well momentum-based strategies using ROC have performed in past market scenarios.
Optimization of ROC parameters such as period length and buy/sell signals is crucial to enhancing the efficacy of trading strategies. Comparing ROC strategies with other indicators can offer insights into their relative performance and suitability for swing trading.
Understanding the strengths and limitations of ROC strategies through thorough evaluation is essential for making informed trading decisions. Through backtesting and analyzing the outcomes, traders can refine their strategies, adapt to changing market conditions, and strive for consistent profitability in swing trading based on the relative performance of ROC indicators.
-Can the ROC Indicator be Used for Both Swing Trading and Day Trading?
Yes, the ROC day trading strategy can be used for both swing trading and day trading. The Rate of Change indicator calculates the difference between the current price and the price from a specified number of periods ago. This can help traders identify momentum shifts and potential trend reversals for both short-term and longer-term trading strategies.
Frequently Asked Questions
Which Indicator Combination Is Best for Swing Trading?
When it comes to swing trading, the combination of the Moving Average Convergence Divergence (MACD) and the Relative Strength Index (RSI) is highly effective. This pairing offers a comprehensive analysis, assisting traders in making informed decisions.
How Do You Trade With ROC Indicator?
To effectively trade with the ROC indicator, monitor overbought or oversold conditions for potential entries or exits. Look for ROC crossovers at the zero level to confirm trend shifts. Incorporate ROC divergence from price action for possible reversals. Combine with other indicators for comprehensive analysis.
What Is the Best RSI Setting for Swing Trading?
A 14-period RSI setting is widely regarded as optimal for swing trading, striking a balance between responsiveness and reliability. This choice allows traders to effectively capture medium-term price changes, identify overbought/oversold conditions, and make informed decisions on entry/exit points.
What Is the Best Moving Average Indicator for Swing Trading?
The Exponential Moving Average (EMA) stands out as the top choice for swing trading due to its ability to swiftly respond to price changes, making it effective for capturing short-term trends and aiding in timely decision-making.
Conclusion
In conclusion, the ROC Indicator serves as a crucial tool for swing traders in assessing market strength and selecting optimal trading opportunities.
By comparing closing prices over specific periods, traders can make informed decisions without falling into overbought or oversold traps.
Just as a compass guides a traveler through unknown terrain, the ROC Indicator guides traders through the complex world of financial markets, leading to enhanced performance and success.