
You may not be aware that following a step-by-step guide to moving averages can significantly enhance your trading skills and decision-making processes.
Understanding the nuances of moving averages and how to apply them strategically can make a substantial difference in your financial analysis outcomes.
By following a structured approach, you can unlock the full potential of moving averages in identifying trends and generating valuable trading signals.
This fundamental knowledge can pave the way for more informed and successful trading strategies.
Benefits of Following Moving Average Steps
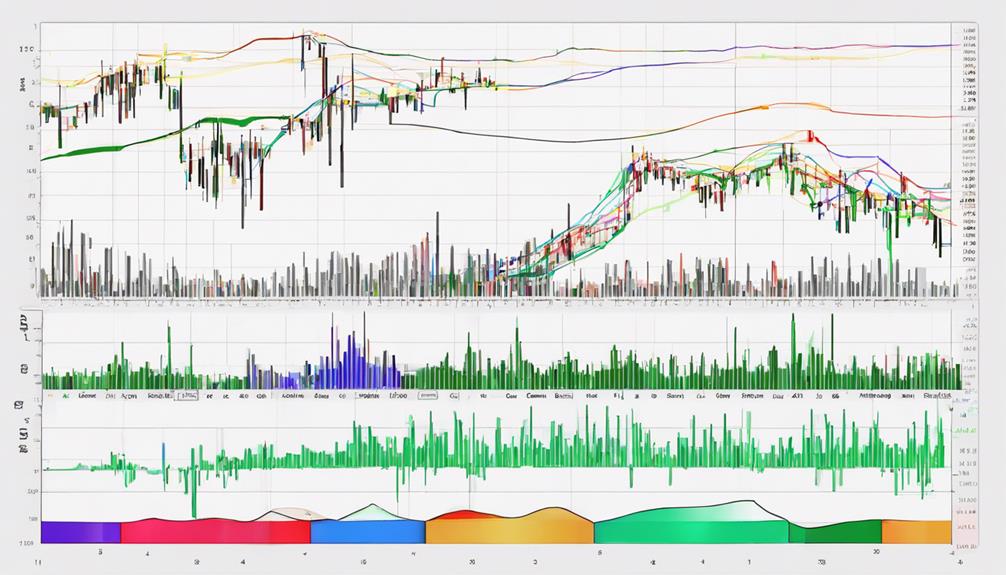
Following a step-by-step guide to moving averages equips traders with a structured approach to effectively utilize them in trend analysis. By using moving averages, traders can identify support or resistance levels and generate trading signals based on the crossovers.
Whether employing a Simple Moving Average (SMA) or an Exponential Moving Average (EMA), adhering to a systematic process ensures accurate interpretation and application. This methodical approach aids in understanding the nuances of moving average analysis, helping traders make informed decisions.
Through step-by-step instructions, traders can configure moving averages to align with their specific trading objectives and timeframes, enhancing overall trading proficiency. Avoiding common pitfalls, such as incorrect setup or misinterpretation, is crucial in maximizing the benefits of using moving averages for successful trading strategies.
Building a Strong Foundation With Moving Averages
To establish a solid groundwork in technical analysis, mastering the fundamentals of moving averages is imperative. Understanding the different types of moving averages, such as Simple Moving Averages (SMA) and Exponential Moving Averages (EMA), is essential for effective market analysis. Here are three key points to consider:
- SMA calculates the average: SMA is calculated by adding up a set of data points over a specific period and dividing it by the number of data points. This helps in smoothing out price fluctuations to identify trends more easily.
- Support and resistance levels: Moving averages assist in determining potential support and resistance levels, which are crucial in making trading decisions.
- Golden Cross and Death Cross: Traders use the Golden Cross (bullish signal) and Death Cross (bearish signal) to predict market trends based on the intersection of two moving averages.
Unpacking the Mechanics of Moving Averages
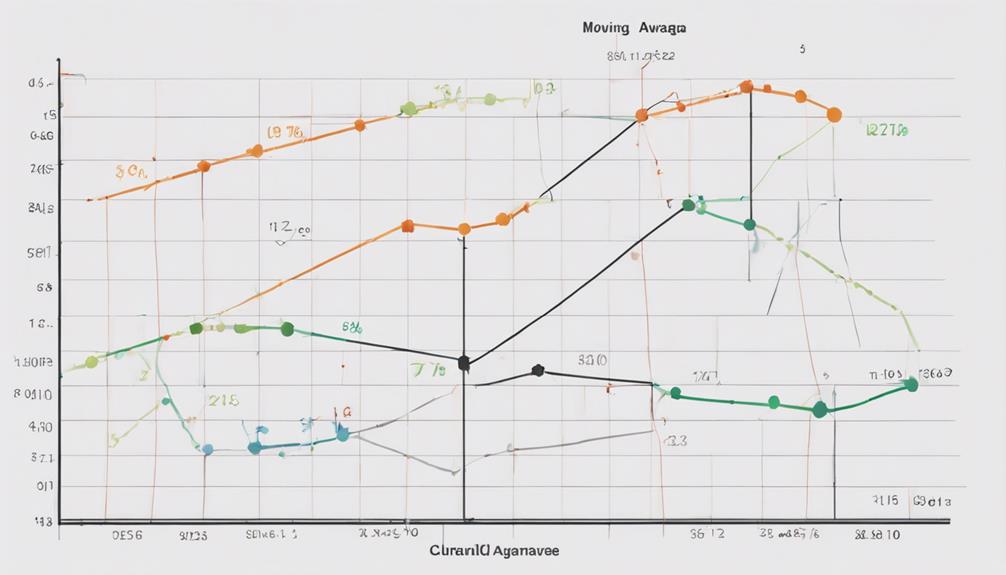
Delve into the intricate workings of moving averages to uncover their underlying principles and functionality in technical analysis strategies. Moving averages, whether simple (SMA) or exponential (EMA), calculate the average price of a security over a specified period, smoothing out price fluctuations.
SMAs assign equal weight to all data points, while EMAs weigh recent data more heavily, making them more responsive to current market conditions. These averages are crucial in market analysis, helping traders identify trends, support/resistance levels, and generate trading signals.
Understanding the mechanics of moving averages is essential for effectively using them in your trading strategy. By grasping how these averages work and their differences, you can make informed decisions based on price movements and trends.
Mastering the Art of Interpreting Moving Averages
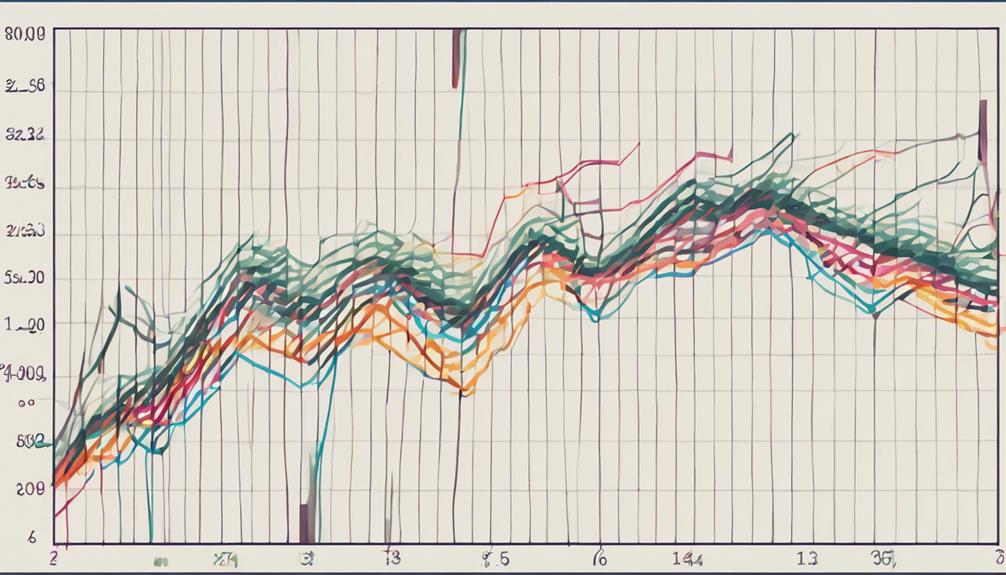
Understanding moving average interpretations involves analyzing the crossovers, trend reversals, support/resistance levels, and momentum to make informed trading decisions based on historical price data and specific timeframes.
When mastering the art of interpreting moving averages, consider the following:
- Crossovers: Identify when short-term averages cross above or below long-term averages to gauge potential shifts in price direction.
- Trend Reversals: Monitor the direction and positioning of moving averages to spot potential changes in market trends.
- Support/Resistance Levels: Utilize moving averages as dynamic support and resistance levels to determine entry and exit points effectively.
What are the benefits of using a step-by-step guide for understanding moving averages?
A moving averages basics tutorial can be incredibly helpful in understanding the concept and its benefits. This step-by-step guide provides a clear explanation of how moving averages work, helping traders make informed decisions. It simplifies a complex topic and makes it accessible for beginners in the stock market.
Implementing Moving Averages in Practice
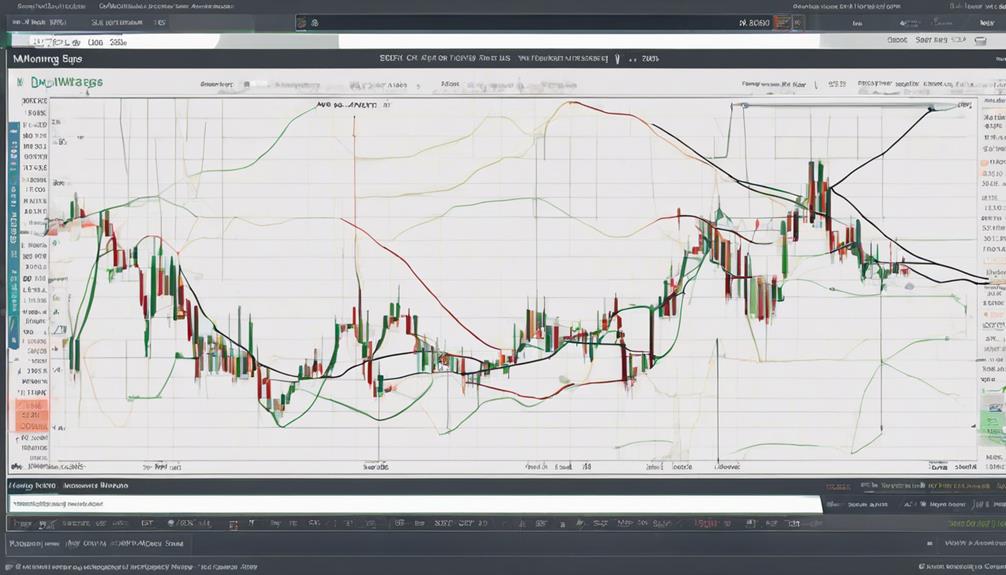
When implementing moving averages in practice, selecting the appropriate period lengths is crucial for aligning with your trading objectives and timeframes effectively. By plotting moving averages on price data, you can visually analyze trends and identify potential entry or exit points.
Keep an eye on crossovers between moving averages as they can signal buy or sell opportunities. Utilize moving averages as dynamic support or resistance levels to validate market trends and strengthen your trade strategies.
Experimenting with different combinations of moving averages allows you to optimize trend analysis and enhance your trading proficiency. Remember to give more weight to recent data points when utilizing moving averages to ensure your analysis accurately reflects current market conditions.
How Can Following a Step-by-Step Guide to Moving Averages Help in Understanding the Basics?
Following a step-by-step guide to moving averages can help in understanding the essential moving averages basics. By learning how to calculate and interpret moving averages, individuals can gain insight into market trends and make informed decisions when analyzing stock prices or any other financial data.
Frequently Asked Questions
What Is One Purpose of Charting Moving Averages?
One purpose of charting moving averages is to identify trends and potential reversal points in price data. They offer visual clarity by smoothing out fluctuations, act as dynamic support and resistance, and provide insights into market sentiment.
What Is the Purpose of the Moving Average Technique?
Smooth out fluctuations, identify trends accurately, and generate trading signals by crossing price movements. Constantly updating to reflect the latest data, moving averages assist in timely decision-making, improving your proficiency in Forex trading.
What Is the Purpose of the Simple Moving Average?
The Simple Moving Average (SMA) smooths out price data over a specified period, aiding in trend identification by filtering short-term fluctuations. It is a widely used tool for determining market support and resistance, providing valuable insights for trading decisions.
What Is the Application of Moving Averages in Real Life?
In real life, moving averages act as a reliable compass, guiding your stock trading decisions with clarity. They smooth out market noise, revealing trends and helping you make informed investment choices. Mastering them enhances your trading strategies.
Conclusion
In conclusion, following a step-by-step guide to moving averages is essential for traders and analysts looking to enhance their market analysis skills.
Remember, 'practice makes perfect,' so by mastering the mechanics and interpretation of moving averages, you can build a strong foundation for successful trading strategies.
Stay disciplined, stick to the process, and watch your proficiency in utilizing moving averages grow over time.