
When analyzing market trends, the Stochastic Oscillator acts as a valuable tool by comparing a security's closing price to its price range over a specific period.
But how does this comparison help you in making informed trading decisions?
Understanding the nuances of the Stochastic Oscillator, from its calculation to practical application, can provide you with insights into market momentum and potential price reversals.
Ready to explore the depths of this technical analysis indicator and enhance your trading strategies?
Key Takeaways on Stochastic Oscillator
When analyzing the Stochastic Oscillator, key takeaways offer essential insights into interpreting market conditions effectively.
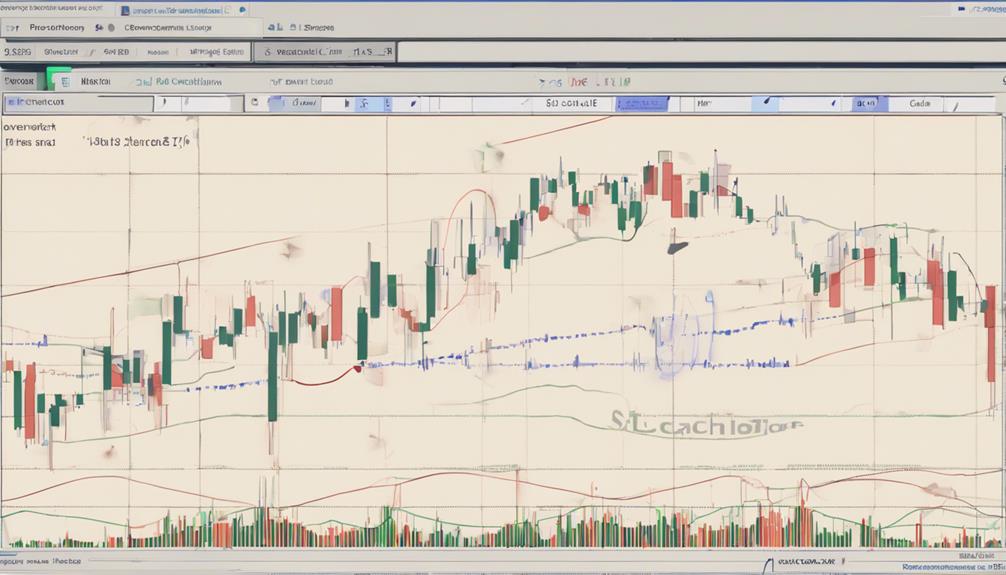
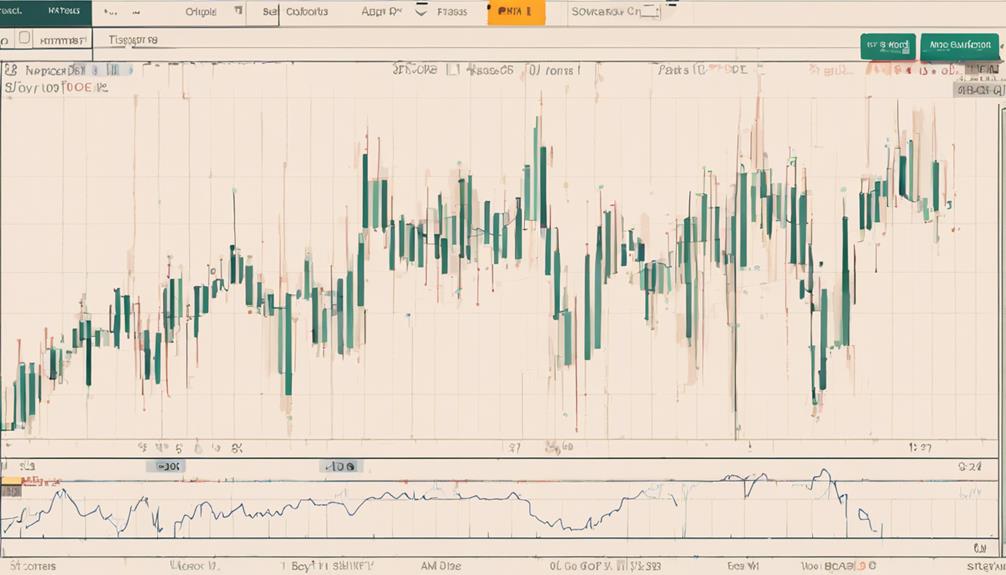
The Stochastic Oscillator is a technical momentum indicator that compares a financial instrument's closing price to its price range over a specific period. It provides valuable signals by indicating overbought conditions when readings exceed 80 and oversold conditions when they drop below 20.
This oscillator aids in predicting potential market reversals based on historical price movements and momentum shifts. Traders and analysts use this tool extensively in financial markets for identifying divergence between the indicator and price action, which can foreshadow upcoming trend changes.
Understanding these key takeaways on the Stochastic Oscillator is crucial for conducting accurate and informed technical analysis.
Understanding Stochastic Oscillator Fundamentals
Comparing a security's closing price to its price range over a specific time period, the Stochastic Oscillator serves as a valuable tool for gauging momentum in financial markets. Here's what you need to know:
- The Stochastic Oscillator is a momentum indicator that operates within a range of 0 to 100.
- Readings above 80 signal overbought conditions, while readings below 20 indicate oversold conditions.
- By analyzing historical returns and divergence between the oscillator and price action, traders can anticipate trend shifts and identify potential trading opportunities. This tool is widely used in technical analysis across various financial markets to enhance decision-making processes.
History and Evolution of Stochastic Oscillator

The inception of the Stochastic Oscillator by George Lane in the late 1950s marked a pivotal moment in the development of technical analysis tools for evaluating market momentum and potential reversals. Lane's creation aimed to provide traders with insights into momentum and potential market reversals, offering a valuable trading signal.
By utilizing a 14-day time period, the Stochastic Oscillator assists in identifying overbought and oversold conditions, crucial for understanding trend shifts in the market. This historical innovation revolutionized how traders analyze price movements, enabling them to make more informed decisions based on the dynamics of price action.
Lane's pioneering work laid the foundation for modern technical analysis methodologies, emphasizing the importance of momentum and trend analysis.
Stochastic Oscillator Calculation and Application
An essential aspect of market analysis, the Stochastic Oscillator plays a key role in evaluating price momentum and potential reversals. To calculate this indicator effectively and apply it in your trading decisions, consider the following:
- The Stochastic Oscillator compares the closing price to the price range over a specific period, often 14 days.
- Calculation involves determining %K by comparing the current close to the period's highest and lowest prices.
- %D, a 3-day simple moving average of %K, smoothens the oscillator's readings for better trend identification.
Comparing Stochastic Oscillator With RSI
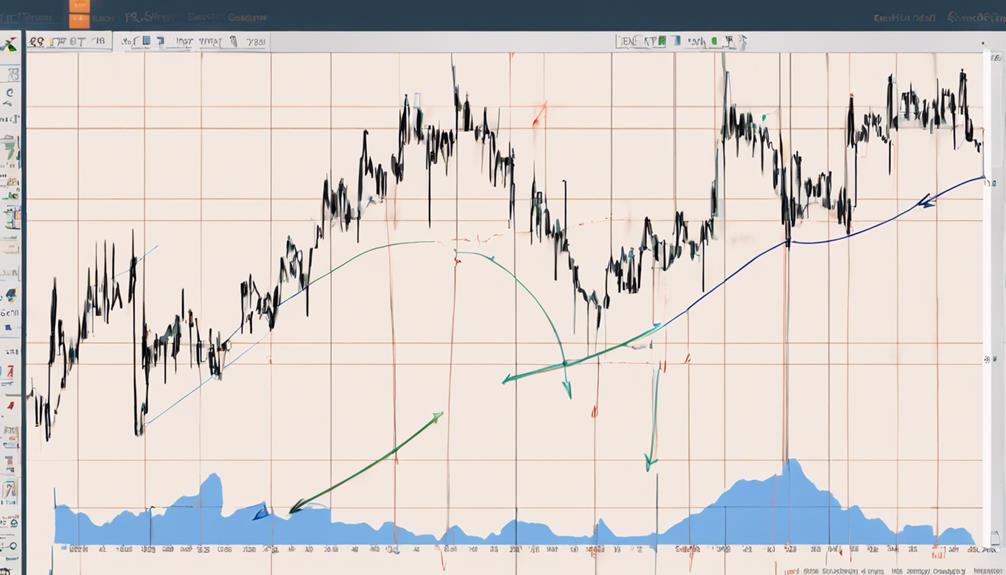
When evaluating price momentum in technical analysis, you can distinguish the Stochastic Oscillator from the Relative Strength Index (RSI) through their unique approaches and suitability to different market conditions. The Stochastic Oscillator focuses on closing prices following the trend, while the RSI tracks overbought and oversold levels by measuring price movement velocity.
RSI is more effective in trending markets, whereas the Stochastic Oscillator performs better in range-bound markets. Each indicator has distinct calculation methods and underlying theories for analyzing market conditions. Understanding these differences can help you choose the most appropriate tool based on the market environment you're trading in, enhancing your ability to make informed decisions in your technical analysis endeavors.
How Can I Use the Stochastic Oscillator Indicator in Technical Analysis?
The stochastic oscillator indicator is of utmost importance in technical analysis. It helps traders identify overbought and oversold market conditions, providing valuable insights into potential trend reversals. By examining the indicator’s readings in conjunction with price movements, traders can make informed decisions on buying or selling assets. The stochastic oscillator indicator importance lies in its ability to enhance trading strategies and improve overall profitability.
Frequently Asked Questions
What Is the Meaning of Stochastic 14 3 3?
In stock trading, "Stochastic 14 3 3" refers to default settings for calculating the Stochastic Oscillator. It signifies the time periods used for %K, %D, and smoothing. Adjust parameters for better signals.
What Is the Best Indicator for Stochastic Oscillator?
You should focus on the Signal Line as the best indicator for the Stochastic Oscillator. It smooths out readings, aiding in trend identification and signal confirmation. Look for %K line crossovers with the Signal Line for trading decisions.
How Do You Trade With a Stochastic Oscillator?
To trade with a stochastic oscillator, identify overbought and oversold conditions. Execute buy orders when %K surpasses %D in oversold zone and sell orders when %K dips below %D in overbought area. Watch for divergences for trend reversals.
Which Is Better RSI or Stochastic?
When deciding between RSI and Stochastic Oscillator, consider market conditions. RSI suits trends, while Stochastic Oscillator is great for ranges. Their combined use can harness their strengths. It's about adapting to the market.
Conclusion
You now understand the significance of the Stochastic Oscillator in technical analysis.
Despite its effectiveness in identifying overbought and oversold conditions, some critics argue that it may generate false signals in volatile markets.
However, by combining it with other technical indicators and exercising caution in extreme conditions, traders can utilize the Stochastic Oscillator to make well-informed trading decisions.
Mastering this tool can enhance your ability to predict market trends and potential reversals.