
Have you ever wondered how volume-based indicators could potentially revolutionize your trading strategy?
The impact of incorporating volume analysis goes beyond just tracking price movements. It opens up a world of nuanced market insights that can guide your decisions towards more profitable outcomes.
By understanding the subtle cues hidden within trading volume, you may uncover untapped opportunities and gain a competitive edge in the markets.
Calculation of Volume-Based Indicators
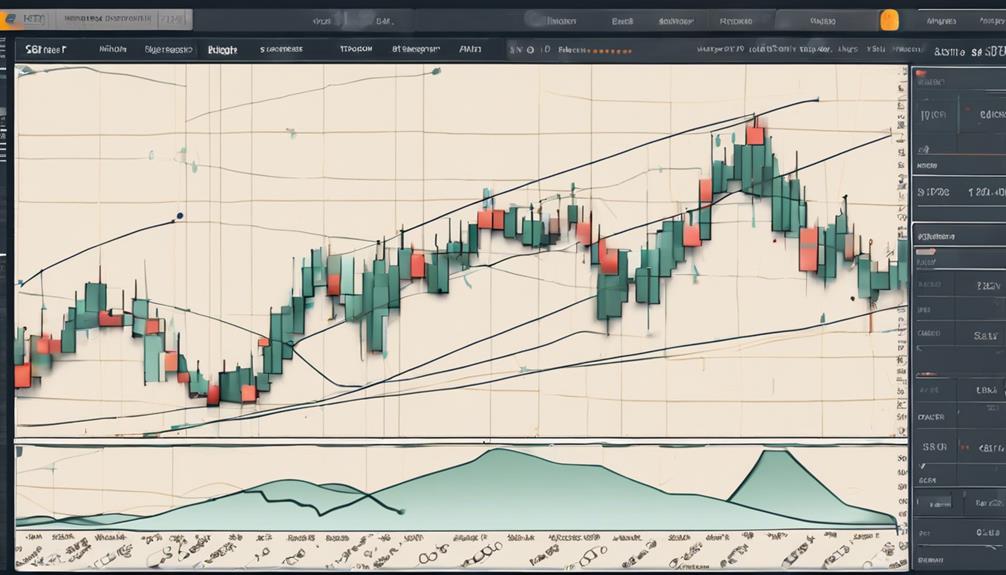
To calculate volume-based indicators, you quantify the traded shares or contracts to derive the indicator. Trading volume plays a crucial role in market analysis as it reflects the level of participation from buyers and sellers.
By tracking trading volumes over different timeframes, you can gain insights into the strength of a trend or potential reversals. Volume-based indicators provide valuable information on market interest and liquidity, aiding in understanding price action dynamics.
Additionally, analyzing volume can help identify Support Levels, where increased trading volume may signal significant market activity. Monitoring volume-based indicators allows traders to gauge the intensity of market movements and make informed decisions based on the underlying trading volumes.
Interpretation and Analysis Techniques
Exploring the interpretation and analysis techniques of volume-based indicators provides traders with valuable insights into market sentiment and price dynamics.
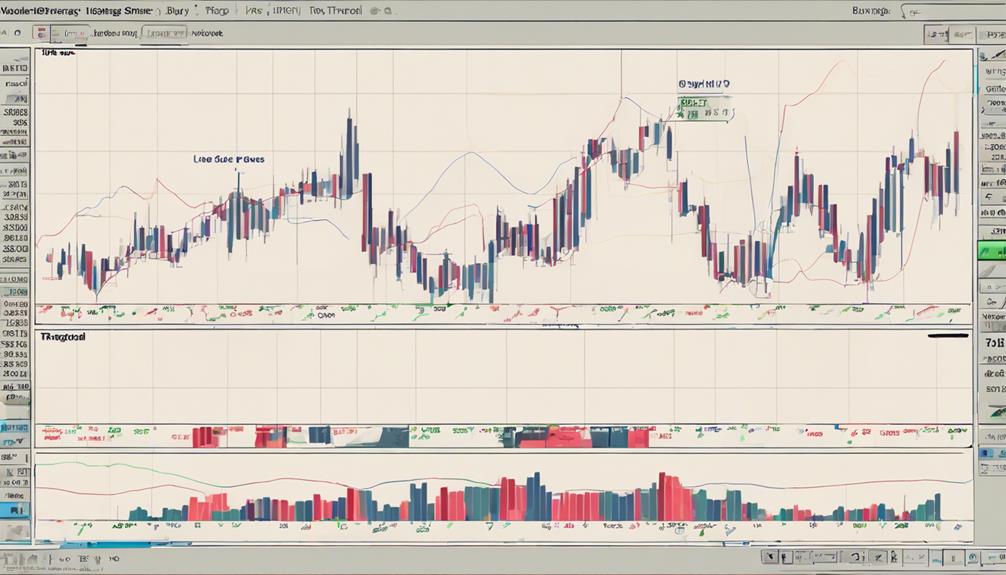
Volume analysis involves studying the relationship between price movements and trading volumes to predict future market trends. High volume during price breakouts suggests strong market interest, indicating a potential continuation of the current trend. Conversely, low volume may signal a lack of market conviction and potential trend reversals.
By utilizing volume-based indicators like On-Balance Volume (OBV) and Chaikin Money Flow, traders can enhance their trading strategies by identifying optimal entry and exit points based on market liquidity and activity levels.
Understanding how to interpret volume spikes and trends can significantly improve trading decisions and overall profitability.
Practical Applications in Trading Strategies
Analyzing volume patterns in trading strategies provides valuable insights for confirming trend strength and potential reversals. Volume indicators such as OBV and Chaikin Money Flow help traders assess liquidity, aiding in trade entry and risk management.
Divergence patterns between price movements and volume can signal trend reversals, prompting adjustments in positions. By incorporating volume indicators, traders enhance their decision-making processes, gaining additional data points on market interest and activity levels.
This technical analysis tool assists in confirming the validity of price breakouts and assessing the ease of trade entry and exit. Utilizing volume-based indicators in trading strategies is essential for effectively managing risk and making informed decisions based on market dynamics.
Advantages and Benefits in Market Analysis
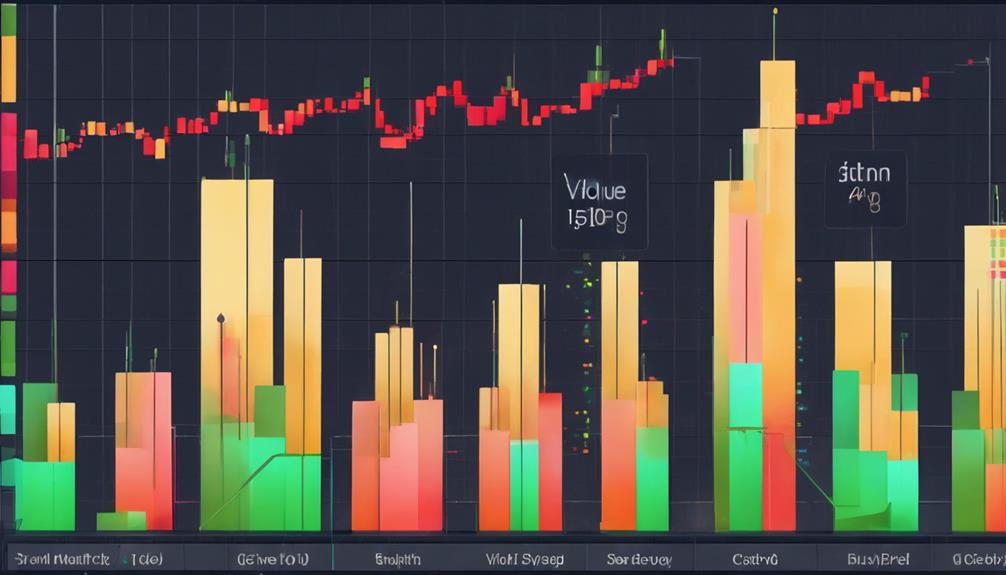
Volume-based indicators play a crucial role in market analysis by providing valuable insights into liquidity levels and activity within the market. By monitoring the number of shares or contracts traded over a specific time, traders can identify trends and patterns.
Increasing volume often indicates heightened interest in a particular asset, signaling a potential change in the direction of the trend. Conversely, a lack of interest reflected in low trading volume may suggest a weakening trend or consolidation phase. These indicators assist in gauging selling pressure and making informed decisions based on the volume of trading activity.
Understanding volume patterns alongside chart patterns enhances analytical capabilities, allowing traders to adapt their strategies effectively.
Limitations and Considerations for Traders

Considerations for traders when utilizing volume-based indicators include potential lag in responding to price movements, the necessity of complementing these indicators with other analytical tools, and the impact of extreme volume spikes on signal accuracy.
- Volume-based indicators may lag behind price movements.
- Combining volume indicators with other technical analysis tools is crucial.
- Extreme volume spikes can lead to false signals.
Understanding the limitations of volume-based indicators in various market conditions, such as low liquidity, is essential for accurate interpretation and informed trading decisions. By recognizing these challenges, traders can enhance their overall analysis by incorporating fundamental analysis or patterns like Head and Shoulders to validate potential trends before making trading decisions.
How Can Volume-Based Indicators Help in Trading?
When it comes to trading, exploring volume indicators tutorial can be incredibly helpful. Volume-based indicators provide valuable insight into market activity, helping traders identify potential trends, confirm price movements, and make more informed decisions. By understanding and utilizing these indicators, traders can improve their overall trading strategy.
Frequently Asked Questions
How Do I Use Frvp?
To use Frvp effectively, define your desired time frame and price range. Analyze volume distribution across different price levels to identify support/resistance. Customize Frvp to align with your strategy for enhanced decision-making and market insights.
What Are the Indicators Based on Volume?
You gotta know this: On-Balance Volume (OBV), Chaikin Money Flow (CMF), Klinger Oscillator, Volume Weighted Average Price (VWAP), and Accumulation/Distribution Line are the key indicators based on volume. They give insights into market dynamics.
What Is the Best Volume Indicator on Tradingview?
When trading on Tradingview, the Volume Profile indicator is widely considered the best for analyzing volume. It offers a comprehensive view of trading activity at various price levels, aiding in identifying key support/resistance levels and market sentiment.
How Do You Read a Vpvr?
To read a VPVR, focus on the histogram peaks which represent significant trading levels. Higher peaks indicate areas of strong volume and potential support or resistance. Use VPVR to identify key price levels with high liquidity and trading interest.
Conclusion
As you navigate the turbulent waters of the market, remember that volume-based indicators are your compass, guiding you through the ebb and flow of market sentiment.
Like a skilled sailor reading the signs of the wind, interpreting volume patterns can lead you to profitable shores.
Embrace the power of volume analysis in your trading strategies, for it holds the key to unlocking the mysteries of market dynamics and steering you towards success.
Fair winds and following seas in your trading journey.