
Exploring the intricacies of utilizing the On-Balance Volume (OBV) indicator in technical trading can provide traders with a valuable edge in navigating the markets. By understanding how OBV tracks buying and selling pressure, traders can gain insights into market sentiment and potential price movements.
However, the true power of OBV lies in its application within various trading strategies and market analysis techniques. As we delve into the depths of leveraging OBV effectively, uncovering advanced trading techniques and maximizing indicator efficiency, a world of possibilities awaits for those seeking to elevate their trading game.
Understanding On-Balance Volume (OBV)
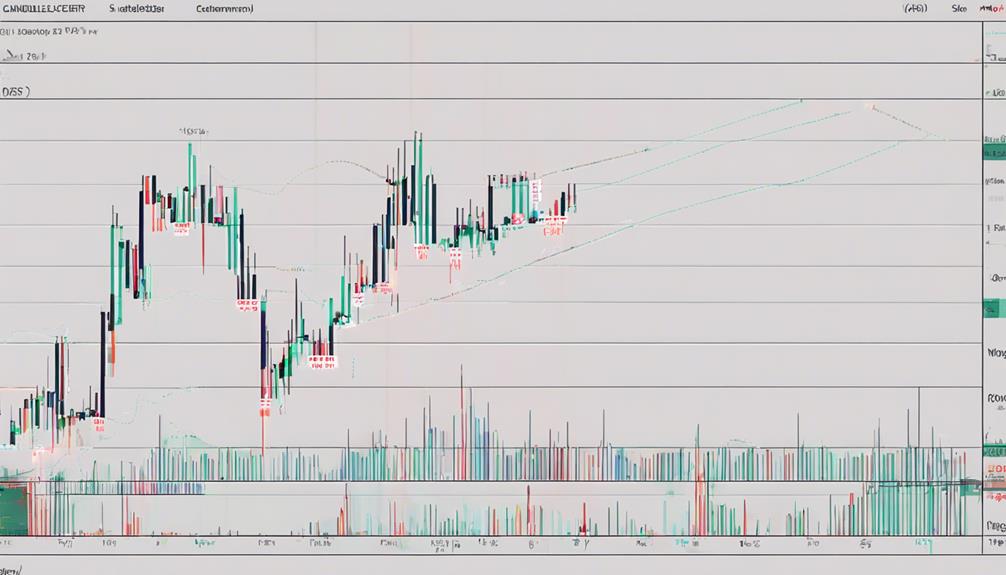
On-Balance Volume (OBV) is a pivotal momentum indicator devised by Joseph Granville in the 1960s to gauge buying and selling pressures in technical trading. This indicator utilizes volume flow to predict changes in stock price.
By adding volume on days when the price closes higher and subtracting volume on days when the price closes lower, OBV focuses on the relationship between volume and price movements. This measure is particularly insightful as it can uncover the strategies of market participants, including the actions of smart money.
By analyzing OBV, traders can identify potential trend reversals, breakouts, or breakdowns in the market before they occur. Understanding OBV provides traders with a valuable tool to assess the strength of a trend and anticipate possible shifts in market sentiment.
It serves as a leading indicator in technical analysis, offering a unique perspective on the interplay between volume, buying, selling, and price movements.
Incorporating OBV in Trading Strategies
Utilizing OBV in technical trading strategies offers traders a nuanced approach to analyzing market dynamics through the interplay of volume and price movements. By incorporating the OBV indicator, traders can use it in various technical trading strategies to enhance their analysis.
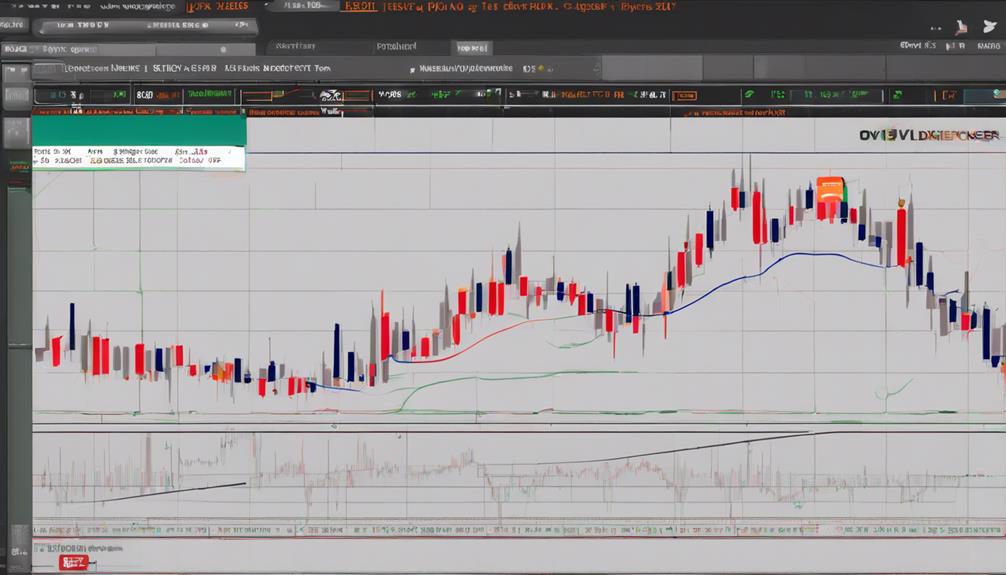
Divergence strategies, for instance, leverage OBV to identify weakening momentum and confirm entry and exit points based on the relationship between price and OBV. Trend confirmation strategies assess the strength of trends by analyzing the historical correlation between price movements and OBV.
Breakout strategies focus on identifying potential breakouts by monitoring the divergence or confirmation between price movements and OBV. Moreover, combining OBV with other technical indicators can provide traders with more comprehensive market analysis, leading to more reliable signals for decision-making.
This integration of OBV into trading strategies equips traders with a tool to interpret higher volumes on upward price movements and lower volumes on downward price movements, aiding in making informed trading decisions.
Leveraging OBV for Market Analysis
When incorporating OBV in market analysis, traders can effectively gauge buying and selling pressure by tracking cumulative volume over time. Utilizing OBV for market analysis provides valuable insights into price movements and potential trends.
Here are three key ways traders can leverage OBV for market analysis:
- Predict Price Changes: OBV acts as a volume flow indicator that measures positive and negative volume flow to predict potential breakouts, breakdowns, and divergence signals in the market.
- Confirm Trends: By combining price movements with OBV readings, traders can use OBV trend confirmation to confirm the strength of a trend, whether it is an uptrend with higher highs and higher lows or a downtrend with lower highs and lower lows.
- Identify Breakouts: OBV can be a useful tool to confirm a breakout in the market. Traders can use OBV divergence and signals for price changes to make informed decisions and potentially capitalize on market movements effectively.
Maximizing OBV Indicator Efficiency
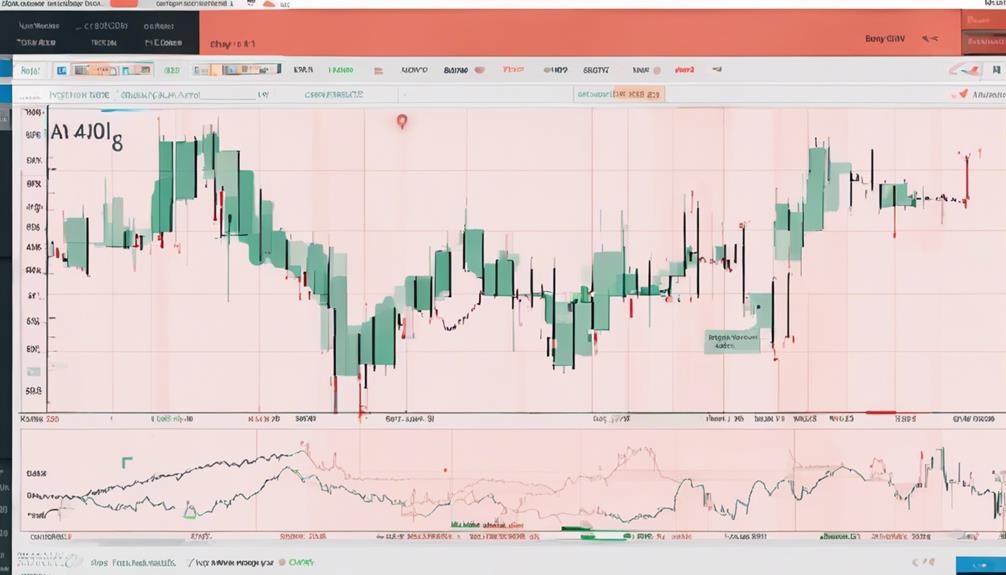
To enhance the effectiveness of the OBV indicator in technical trading, optimizing the selection of timeframes is crucial for maximizing its efficiency. OBV measures buying and selling pressure through volume fluctuations, indicating accumulation or distribution within a trading range.
Rising OBV during a trading range suggests accumulation and the potential for an upward breakout, signaling a bullish trend. Conversely, falling OBV during a trading range suggests distribution and the potential for a downward breakout, indicating a bearish trend.
Additionally, observing negative or positive divergences between price movements and OBV can provide valuable insights into potential trend reversals or continuations. By paying close attention to these dynamics and using OBV in conjunction with price analysis, traders can better identify entry and exit points, ultimately maximizing OBV efficiency in their trading strategies.
Advanced OBV Trading Techniques
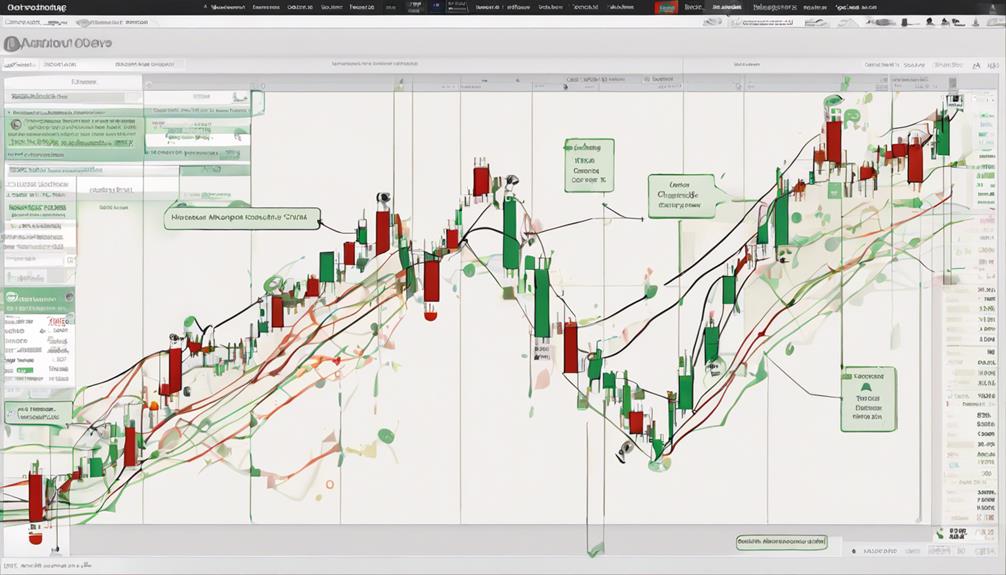
Advanced traders adept at utilizing the On-Balance Volume (OBV) indicator often incorporate sophisticated divergence strategies and trend confirmation techniques to enhance their technical trading prowess. When delving into advanced OBV trading techniques, traders focus on:
- Divergence Strategies: These strategies help identify weakening momentum by analyzing discrepancies between price movements and OBV trends.
- Trend Confirmation: By analyzing the relationship between price movements and OBV over time, traders confirm trends and make informed decisions.
- Breakout Strategies: Utilizing OBV volume surges, traders wait for confirmation signals and use additional indicators to assess breakout strength.
Implementing OBV in trading strategies not only provides insights into market player strategies but also helps predict potential breakouts or breakdowns, aiding traders in making well-informed trading decisions. Combining OBV with moving averages and experimenting with customized approaches like anchored OBV scanners can further enhance the effectiveness of OBV in predicting market movements.
How Can I Use OBV in Technical Trading to Improve My Analysis?
The importance of OBV in analysis lies in its ability to confirm price trends and predict potential trend reversals. By using OBV in technical trading, you can improve your analysis by identifying divergence between OBV and price, which can indicate a change in trend direction.
Frequently Asked Questions
How Do You Use OBV in Trading Strategy?
In trading strategies, OBV is utilized to identify divergence between price and volume, confirm trends, and spot breakout opportunities. Combining OBV with other indicators can enhance signal accuracy, aiding in determining optimal entry and exit points.
What Is the Best Time Frame for OBV Indicator?
For the OBV indicator, the best time frame selection hinges on trading objectives and style. Daily charts suit long-term analysis, while shorter time frames like 15 or 30 minutes cater to intraday traders. Adaptability is key for effective OBV utilization.
What Are the Disadvantages of Obv?
The disadvantages of OBV include susceptibility to false signals, distortion from volume spikes, limitations in certain markets, and the need for supplementary indicators for confirmation. Awareness of these drawbacks is crucial for informed and effective trading decisions.
How Do You Analyze Obv?
Analyzing OBV involves tracking its direction to gauge trend strength. Higher peaks in both price and OBV signal potential upward trends, while falling OBV during a range may indicate distribution. Watch for divergence for stall points in trends.
Conclusion
In conclusion, the Guide to Utilize OBV in Technical Trading provides traders with a comprehensive understanding of how to effectively incorporate the On-Balance Volume indicator in their trading strategies.
By analyzing buying and selling pressure through OBV, traders can make informed decisions and enhance their technical analysis.
With practical recommendations and advanced techniques, traders can maximize the efficiency of OBV to improve their trading outcomes.
As the saying goes, 'knowledge is power' – and mastering OBV can give traders a powerful edge in the market.