
Volatility indicators play a crucial role in shaping successful stock trading strategies by offering valuable insights into market dynamics and risk management. Traders who harness the power of these indicators can gain a competitive edge in navigating the complexities of the financial markets.
Understanding how to interpret and apply volatility indicators like Bollinger Bands, ATR, and Donchian Channel can significantly impact trading decisions and outcomes. By incorporating these tools effectively, traders can better position themselves to capitalize on market opportunities and optimize their trading performance.
Key Volatility Indicators Overview
Analyzing key volatility indicators provides crucial insights into market dynamics and aids in making informed trading decisions. Volatility indicators such as Average True Range (ATR), Bollinger Bands, Keltner Channel, Donchian Channel, and India VIX play a significant role in assessing market volatility levels.
ATR measures the true range of price bars, indicating changes in market volatility. Bollinger Bands, comprising upper, lower, and middle bands, expand with increased volatility, offering insights into potential price breakouts. Keltner Channel utilizes ATR for trend continuation signals and trend direction determination.
Donchian Channel, on the other hand, is renowned for assessing market price volatility and signaling buy/sell trades based on band breaks. India VIX reflects near-term volatility expectations, providing valuable information on market perception.
Understanding these volatility indicators, alongside tools like Relative Volatility Index (RVI) and Standard Deviation indicator, aids traders in navigating market fluctuations and gauging implied volatility levels for strategic decision-making.
Bollinger Bands Strategy
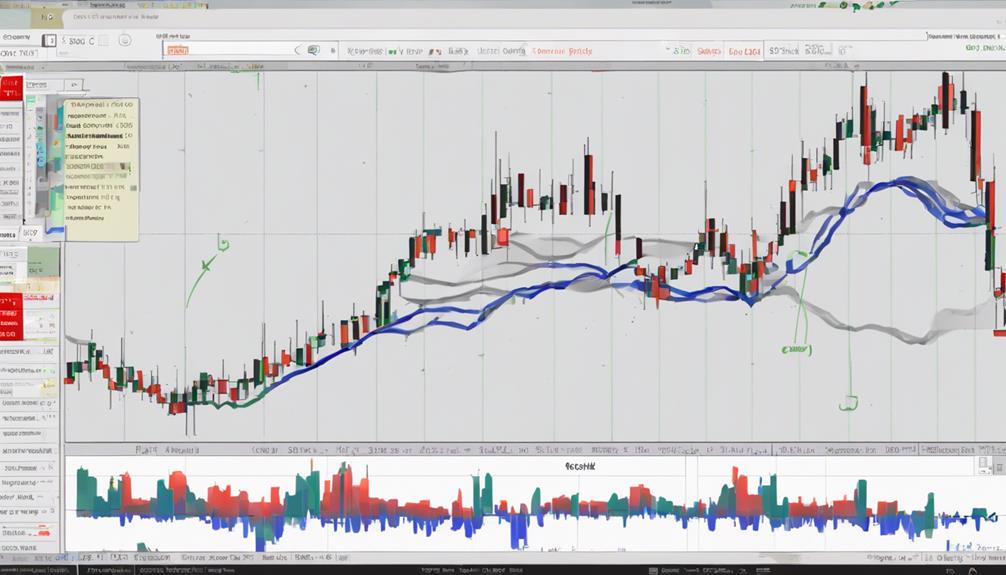
The Bollinger Bands Strategy is a widely utilized method in stock trading that involves interpreting price movements based on upper and lower bands derived from standard deviations of a moving average. These bands are dynamic and adjust to market volatility, expanding during volatile periods and contracting during calmer times. Traders often use Bollinger Bands to identify potential price breakouts or reversals.
When prices touch the upper band, it may indicate an overbought condition, suggesting a possible downward correction. Conversely, when prices touch the lower band, it could signal an oversold condition, indicating a potential upward correction. The middle band, which represents the 20-day moving average, acts as a centerline for price movements.
Additionally, traders frequently combine Bollinger Bands with other indicators to seek confirmation signals for their trading decisions. By utilizing Bollinger Bands effectively, traders can enhance their trading strategies and make more informed decisions in the stock market.
Keltner Channel Application
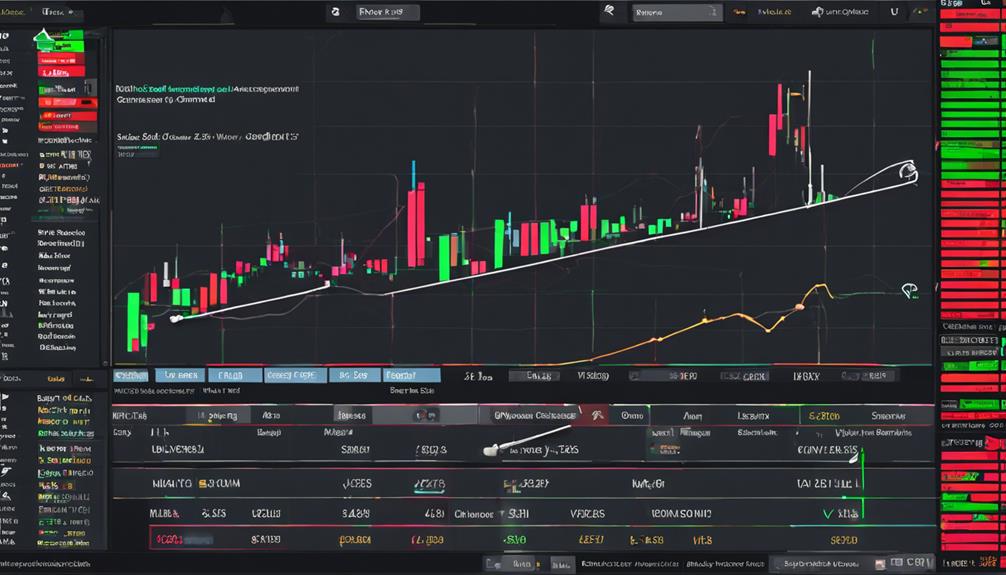
Utilizing the Average True Range (ATR) as a measure of price volatility, the Keltner Channel Application provides traders with a methodical approach to identifying trend continuation signals in stock trading. Keltner Channels are constructed around an Exponential Moving Average (EMA) line, with upper and lower channels based on ATR multiples. This setup helps traders determine the trend direction and anticipate potential market breakouts.
Key features of Keltner Channels include the dynamic width adjustments of the channels, expanding during high volatility periods and contracting during low volatility periods. Traders can effectively utilize Keltner Channels to establish appropriate stop-loss levels and make well-informed trading decisions based on the signals generated by the indicator.
Donchian Channel Usage

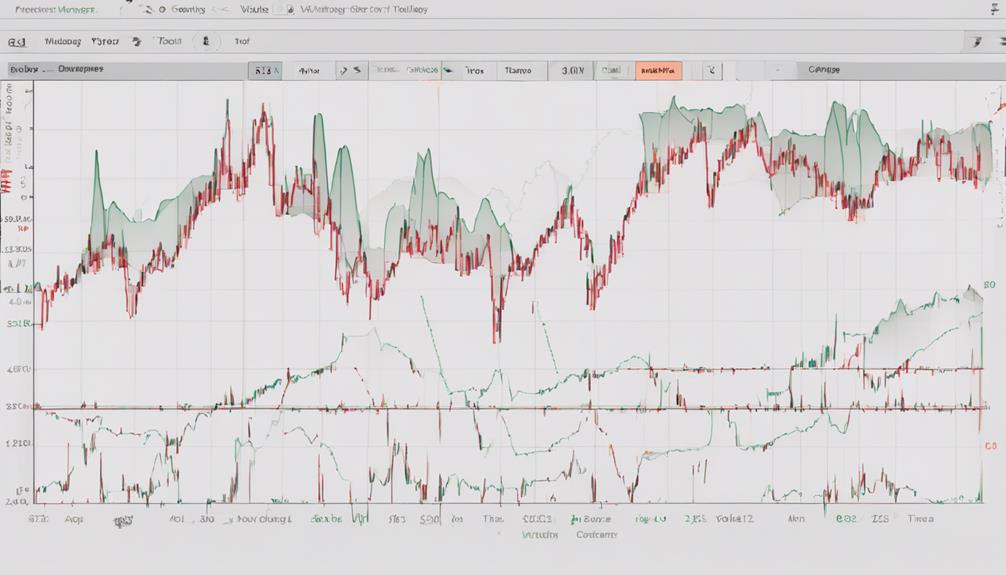
Drawing on the principles of technical analysis and volatility indicators, the application of Donchian Channels in stock trading offers traders a structured framework for identifying market opportunities based on measured volatility levels.
Developed by Richard Donchian, these channels consist of three lines: the upper band, lower band, and middle band, with the middle band representing the average price over a specific period. Traders utilize Donchian Channels to gauge market volatility, as wider channels indicate higher volatility levels, potentially signaling trading opportunities.
Breakouts occur when prices surpass the upper or lower bands, prompting traders to consider potential trading signals. Moreover, these channels help establish support and resistance levels, enabling traders to track price movements and make informed decisions based on the observed market volatility.
Leveraging Average True Range
Incorporating Average True Range (ATR) into stock trading strategies enhances risk management and aids in identifying market opportunities based on measured volatility levels. ATR, a key volatility indicator, calculates the average price range within a specified period, enabling traders to make informed decisions.
Here are key ways traders leverage ATR:
- Setting precise stop-loss orders according to market volatility levels.
- Determining optimal position sizes based on ATR values.
- Identifying potential breakouts and anticipating market reversals through ATR analysis.
Understanding ATR values is crucial for adapting trading strategies to varying market conditions and effectively managing risk. A higher ATR value signifies heightened market volatility, prompting traders to adjust their risk management approach, while a lower ATR value indicates a less volatile market environment.
How Can Volatility Indicators Improve Stock Trading Strategies?
Grasping volatility indicators helps traders make informed decisions based on market fluctuations. By understanding the level of price variability, investors can adjust their trading strategies to mitigate risk and capitalize on potential opportunities. Volatility indicators provide valuable insight into market sentiment, allowing traders to make more confident and profitable decisions.
Frequently Asked Questions
How Do You Use Volatility Indicator in Trading?
In trading, volatility indicators are crucial for assessing price fluctuations and predicting potential market movements. By analyzing these indicators, traders can make informed decisions on entry and exit points, manage risk effectively, and capitalize on market opportunities.
What Is the Best Stock Volatility Indicator?
Determining the best stock volatility indicator is subjective, influenced by individual trading strategies. Bollinger Bands, Average True Range (ATR), Volatility Index (VIX), and Keltner Channels are popular choices, each offering unique insights into price movements and market sentiment.
What Is the Best Trading Strategy for Volatility?
The best trading strategy for volatility involves a systematic approach to identifying market trends and breakouts, implementing stop-loss orders based on volatility indicators, and utilizing tools like Renko charts for smoother price analysis. Managing risks effectively is crucial.
What Is the Most Successful Trading Indicator?
The most successful trading indicator is subjective, depending on individual trading styles and preferences. Commonly used indicators like Moving Averages, RSI, and MACD help inform decisions, identify trends, and determine entry and exit points. Traders often combine multiple indicators for comprehensive analysis.
Conclusion
In the intricate world of stock trading, utilizing volatility indicators is akin to navigating a turbulent sea with a reliable compass.
Bollinger Bands, ATR, and Donchian Channel serve as indispensable tools for traders seeking to analyze market volatility, manage risk, and make informed decisions.
By incorporating these indicators into their trading strategies, traders can steer their way through the unpredictable waters of the stock market with greater precision and confidence.