
In the realm of technical analysis, mastering Elliott Wave patterns can be a game-changer for traders navigating the complexities of the financial markets. The ability to decipher these patterns can provide valuable insights into potential market trends and reversals.
As traders strive to enhance their skills and gain a competitive edge, a visual guide that offers a structured approach to understanding and applying Elliott Wave Theory becomes an indispensable asset. This guide not only sheds light on the intricacies of wave patterns but also equips traders with practical tools to make informed trading decisions.
Understanding Elliott Wave Theory
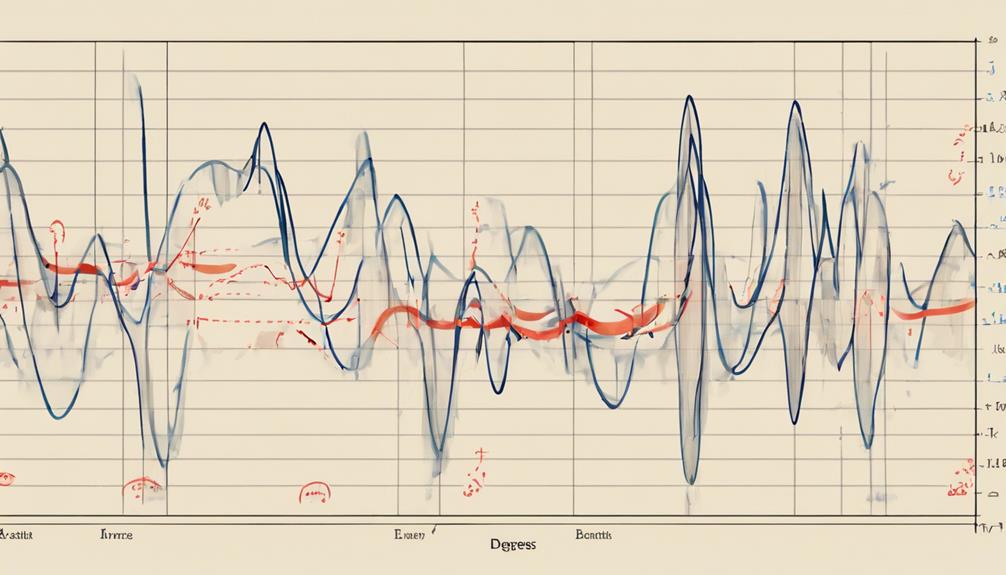
Understanding Elliott Wave Theory is crucial for traders seeking to predict future price movements in financial markets with greater accuracy. This method of technical analysis is based on the idea that market prices exhibit repetitive patterns influenced by crowd psychology.
Elliott Wave Theory distinguishes between impulse waves, which align with the main trend, and corrective waves, which run counter to it. By recognizing these wave patterns, traders can anticipate potential market turning points. The theory provides a structured framework with rules and guidelines for interpreting wave counts, Fibonacci ratios, and wave relationships.
This allows traders to develop effective trading strategies centered around the concept of wave patterns. Ultimately, mastering Elliott Wave Theory equips traders with a deeper understanding of market dynamics and enhances their ability to make informed decisions based on the ebbs and flows of market sentiment.
Identifying Impulse Waves
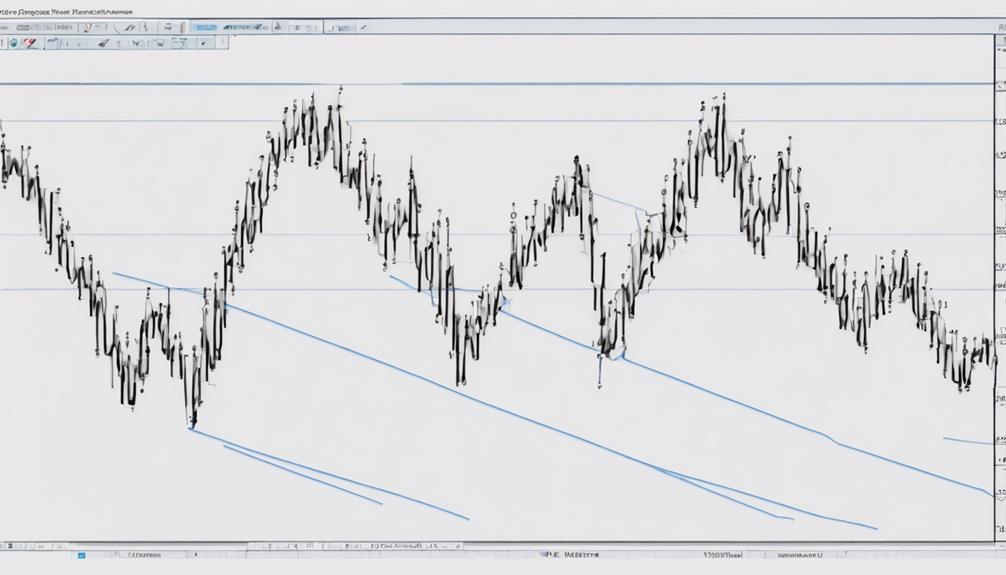
Impulse waves, as the directional components within an Elliott Wave pattern, play a pivotal role in indicating the primary trend's movement. When identifying impulse waves, traders should focus on specific characteristics and rules:
- Five Waves Structure: Impulse waves consist of five waves labeled 1, 2, 3, 4, and 5. These waves move in the direction of the main trend, providing insight into the market's momentum.
- Strong Price Momentum: Impulse waves typically exhibit strong price momentum in the direction of the larger trend. Wave 3, in particular, is often the strongest and is never the shortest within the impulse wave sequence.
- Trading Opportunities: Correctly identifying impulse waves is crucial for traders as it helps in understanding market direction and potential trading opportunities. By recognizing these directional moves early on, traders can capitalize on the trends and make informed trading decisions based on the Elliott Wave principle.
Recognizing Corrective Waves
In Elliott Wave theory, Corrective waves are denoted by specific letter labels and typically exhibit a countertrend movement opposite to the primary market trend. Wave A marks the initial phase of the correction, Wave B represents a partial retracement, and Wave C concludes the correction by moving against the main trend. These corrective waves can manifest in various patterns such as zigzags, flats, triangles, or combinations, each adhering to specific structural rules.
Recognizing these corrective waves is essential for traders as it allows them to anticipate potential market reversals or consolidation phases. By understanding the characteristics and patterns of corrective waves, traders can develop informed trading strategies that capitalize on these countertrend movements. Applying Elliott Wave principles to identify and interpret corrective waves provides traders with valuable insights for making strategic trading decisions in dynamic market environments.
Exploring Fibonacci Ratios
Fibonacci ratios play a pivotal role in Elliott Wave analysis, enabling traders to pinpoint potential reversal and extension levels within wave patterns. When exploring Fibonacci ratios in the context of Elliott Wave analysis, several key points emerge:
- Identification of Reversal and Extension Levels: Common Fibonacci ratios such as 0.382, 0.500, 0.618, 1.000, 1.618, and 2.618 are utilized to identify potential reversal and extension levels within wave patterns.
- Confluence for Trade Setups: Traders often seek confluence between Fibonacci levels and Elliott Wave counts to enhance the probability of successful trade setups. This confluence acts as a confirmation signal for potential price movements.
- Determining Target Levels: Fibonacci ratios are crucial in determining target levels for price movements within the Elliott Wave structure. Understanding how these ratios align with wave patterns can aid in setting realistic targets and implementing effective risk management strategies.
Applying Elliott Wave Patterns

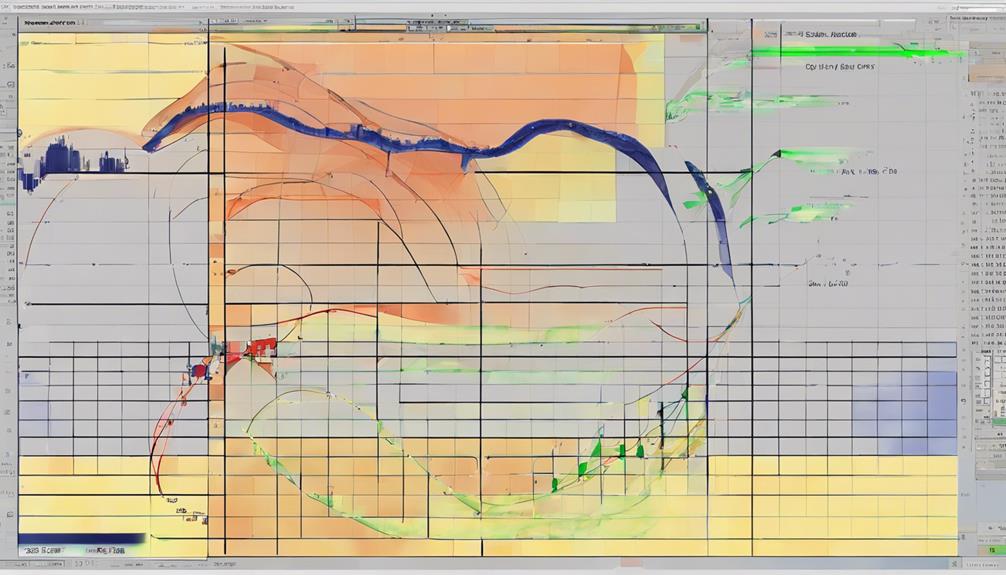
Elliott Wave patterns serve as a valuable tool for traders seeking to anticipate and capitalize on market movements efficiently. By understanding these patterns, traders can identify mass psychology swings in financial markets, enabling them to make informed trading decisions. Two key concepts in applying Elliott Wave patterns are recognizing ending diagonals in Wave C and trading triangles.
Practical examples and case histories are often employed to illustrate the application of these patterns in trading scenarios. Additionally, combining Elliott Wave patterns with technical indicators can provide traders with high-confidence trading opportunities. This integration allows for a more comprehensive analysis of the market, leading to well-informed and strategic trading decisions.
Is It Necessary to Have a Visual Guide in Understanding Elliott Wave Patterns?
Yes, having a visual guide is crucial in understanding Elliott Wave patterns. Being able to see the wave patterns unfold on a chart can provide clarity and insight into the complex movements of the market. With a visual aid, understanding Elliott Wave patterns becomes much easier and more accessible for traders.
Frequently Asked Questions
What Are the 3 Rules of Elliott Wave?
The three rules of Elliott Wave theory are crucial for wave analysis: Wave 2 must not exceed the endpoint of Wave 1, Wave 3 should never be the shortest impulse wave, and Wave 4 must not overlap with Wave 1.
How Do I Identify My Elliott Wave Pattern?
Identifying your Elliott Wave pattern involves meticulously counting waves in price movements, recognizing a five-wave pattern succeeded by a three-wave correction. Confirm with Fibonacci retracement levels and assess wave characteristics like length and structure for accurate pattern identification.
What Is the Best Elliott Wave Indicator?
Determining the best Elliott Wave indicator hinges on personal trading preferences. Common choices include Fibonacci retracement levels, moving averages, RSI, and MACD for trend confirmations. The Stochastic Oscillator aids in pinpointing overbought or oversold conditions within wave structures.
Is the Elliott Wave Nonsense?
The debate over the validity of the Elliott Wave theory persists among traders. While some view it as nonsensical due to its subjective nature and lack of empirical evidence, others find value in its potential for identifying market trends and turning points.
Conclusion
In conclusion, 'Your Essential Visual Guide to Elliott Wave Patterns' offers traders a practical approach to understanding and applying Elliott Wave principles. With a focus on technical analysis, the book provides valuable insights into identifying impulse and corrective waves, exploring Fibonacci ratios, and applying Elliott Wave patterns.
Interestingly, a study by Market Technicians Association revealed that 90% of professional traders use Elliott Wave analysis in their decision-making process, highlighting its significance in the financial markets.