
So, you think you've mastered the basics of day trading, but have you truly harnessed the power of volume-based indicators?
These tools can make or break your trading success. Understanding how to interpret volume data can be a game-changer in your day trading strategy.
Stay tuned to unravel the seven essential tips that could elevate your trading game to the next level.
Importance of Volume-Based Indicators
To grasp the significance of volume-based indicators in day trading, understanding their role in analyzing market dynamics is crucial. Volume, a key indicator, reflects the number of shares traded within a specific time frame. This data point is vital for traders as it helps in confirming trends identified by price movements.
By incorporating volume into technical analysis, traders gain a more comprehensive view of market activity, allowing them to make informed decisions. Monitoring volume can also aid in predicting potential price reversals, identifying market sentiment, and confirming the strength of a trend.
Successful stock traders rely on volume-based indicators like OBV, MFI, VWAP, and Accu to gauge buying and selling pressure accurately, ultimately leading to profitable trading strategies.
Choosing the Right Volume Indicator

When selecting a volume indicator, consider factors like your trading style, preferred timeframes, and the specific insights you aim to gain.
Different volume indicators offer unique perspectives on market activity and price movements, aiding in decision-making processes.
Understanding how each indicator functions and aligning it with your trading goals can enhance your ability to interpret volume data effectively.
Indicator Types
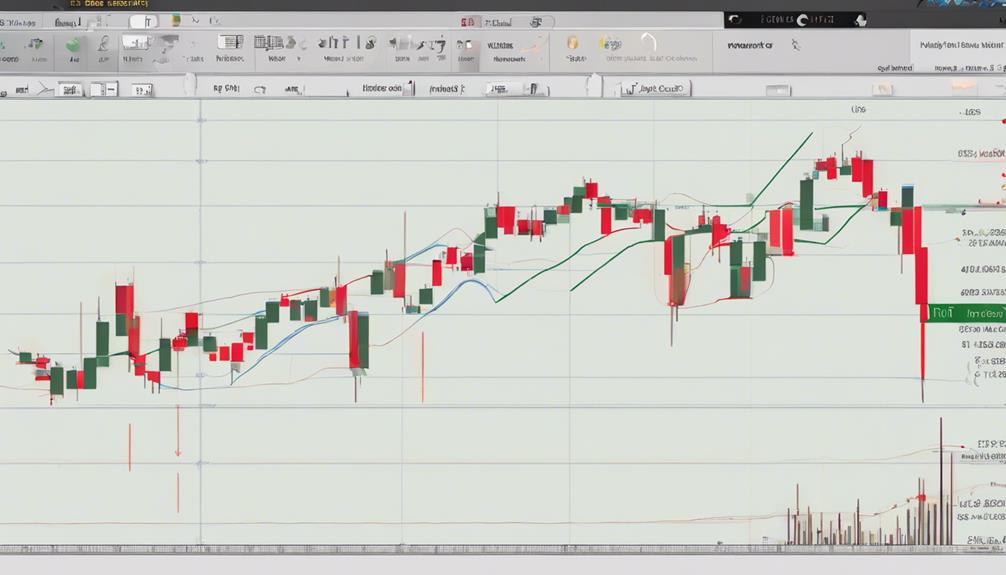
Selecting the appropriate volume indicator plays a pivotal role in enhancing the precision of your day trading strategies. Understanding different types like On-Balance Volume (OBV), Money Flow Index (MFI), Volume-Weighted Average Price (VWAP), and Accumulation/Distribution Line (Accu) is essential.
OBV tracks trading pressure by summing up volume on up days. MFI helps identify overbought or oversold areas. VWAP shows the average price traded at, aiding trend confirmation. Accu indicates potential trends based on volume activity.
Each indicator offers unique insights into market dynamics, helping you make informed trading decisions based on volume movements and trends. Make sure to choose the volume indicator that aligns best with your day trading strategy to maximize your trading effectiveness.
Interpretation Tips
Pivotal in enhancing the precision of your day trading strategies, the choice of volume indicator is critical for gauging market dynamics effectively.
To gauge buying and selling pressure, consider using the On-Balance Volume (OBV) indicator.
For identifying overbought or oversold conditions, opt for the Money Flow Index (MFI) as a volume-weighted Relative Strength Index (RSI).
Utilize the Volume-Weighted Average Price (VWAP) indicator for trend confirmation on intraday charts and institutional trading strategies.
The Accumulation/Distribution Line (Accu) can help understand the relationship between price and volume, aiding in predicting potential price trends.
Keep an eye out for divergences between volume indicators and stock price movements to anticipate possible price reversals in day trading scenarios.
Using Volume to Confirm Trends
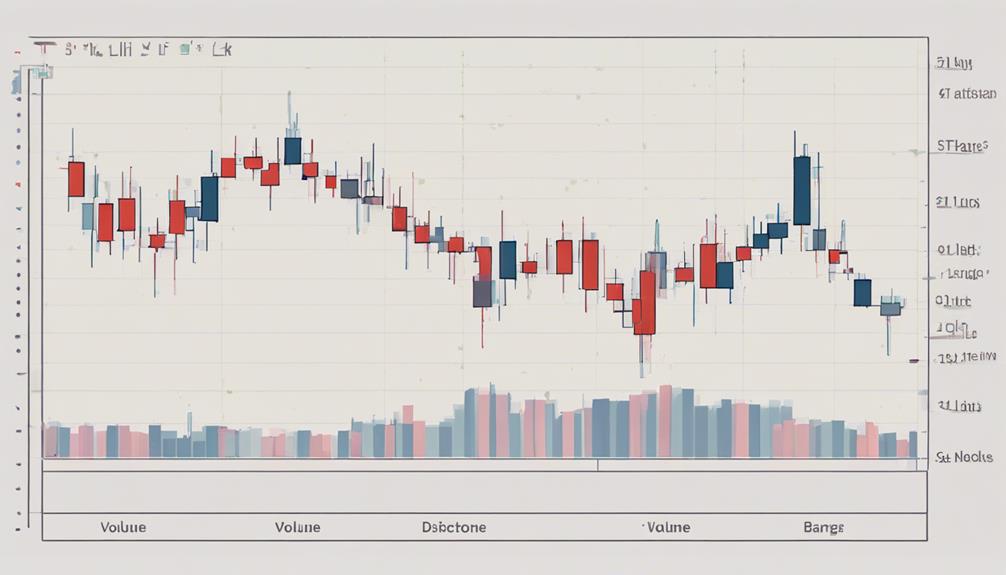
To confirm trends effectively, traders must closely monitor the relationship between price movements and corresponding volume levels. Rising markets with increasing volume confirm the strength of the trend, while falling prices accompanied by high volume indicate a potential downtrend continuation. Analyzing volume behavior during price breakouts helps confirm the validity of the breakout.
Additionally, divergence patterns between price and volume can signal a potential trend reversal. By incorporating volume indicators into their analysis, day traders can assess the liquidity and strength of trends for making informed trading decisions. Paying attention to high volume situations can provide crucial insights into the validity of breakouts and the overall robustness of the trend.
Identifying Exhaustion Moves With Volume
When observing exhaustion moves with volume, you can look for significant spikes in trading activity that signal potential trend reversals.
Volume divergence analysis can help you pinpoint moments when buying or selling pressure might be reaching extremes.
Combining these volume-based indicators can assist you in anticipating market shifts and strategizing your trades accordingly.
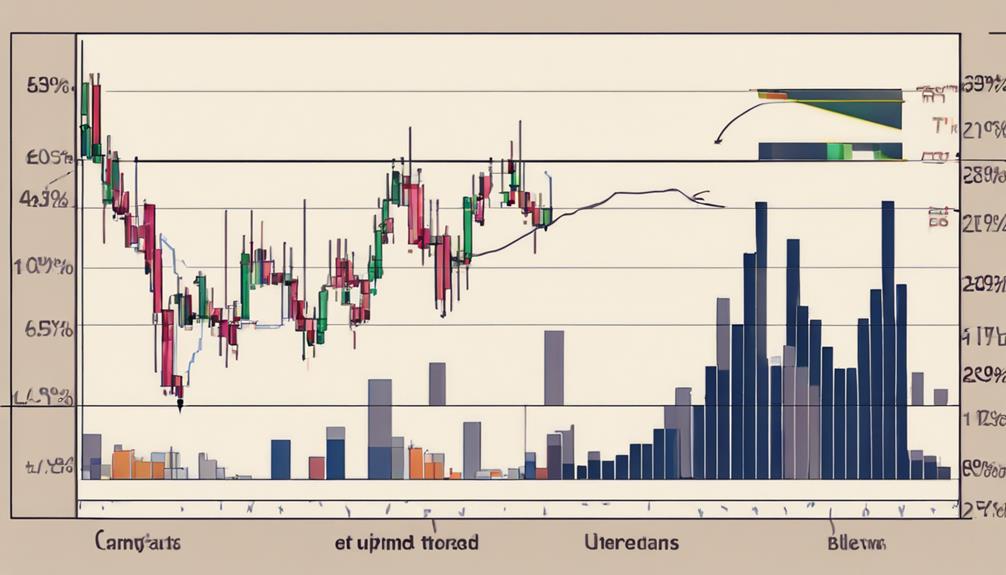
Volume Spike Signals
Identifying exhaustion moves in the market becomes more feasible when volume spikes signal a surge in trading activity. Volume spike signals often indicate potential reversals or trend endings, offering traders valuable insights into market sentiment.
By comparing current volume spikes to historical data, one can assess the strength or weakness of a price movement, aiding in making informed trading decisions. Understanding exhaustion moves with volume spikes is crucial for effective risk management in day trading.
These signals serve as a valuable tool for traders to confirm market sentiment and anticipate shifts, allowing for proactive decision-making based on data-driven analysis.
Volume Divergence Analysis
Following the surge in trading activity signaled by volume spikes, day traders leverage volume divergence analysis to anticipate potential exhaustion moves or trend reversals in the market.
Volume divergence occurs when the price moves opposite to the volume direction, aiding in identifying exhaustion moves. High volume coupled with price stagnation or low volume during significant price shifts can signal potential trend reversals.
This analysis is crucial for confirming price trend sustainability in day trading. Traders utilize volume-based indicators to detect these divergence patterns, enabling them to make well-informed trading decisions.
Recognizing Bullish Signals From Volume
To recognize bullish signals from volume, observe rising stock prices coupled with increasing trading activity. When analyzing volume indicators for day trading, keep an eye out for the following cues:
- Rising stock prices with increasing volume indicate bullish strength and conviction in the market.
- High volume on breakouts confirms the validity of price movements and suggests further upward potential.
- Divergence between price and volume can signal possible bullish reversals, presenting trading opportunities.
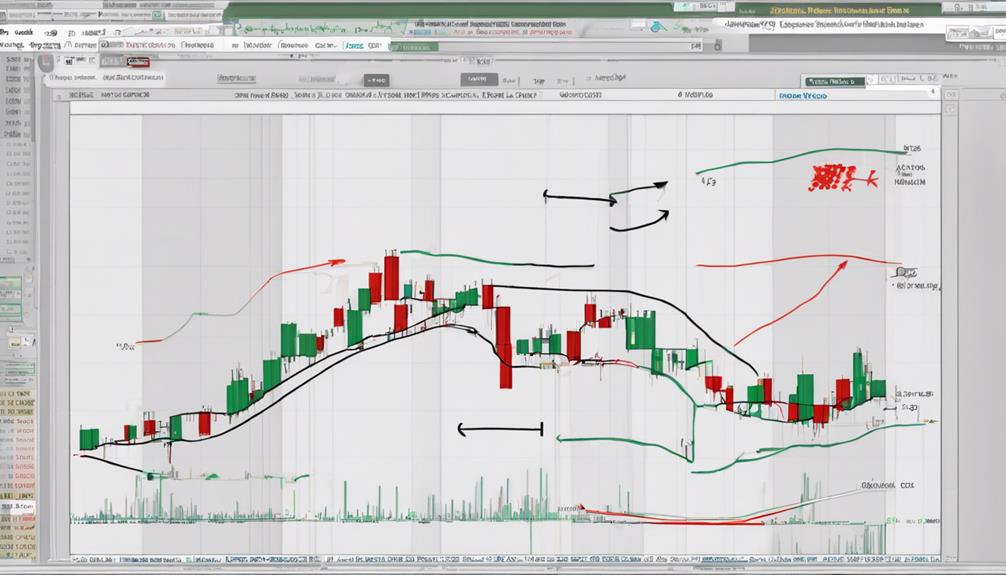
Volume's Role in Price Reversals

Volume plays a crucial role in forecasting price reversals in the financial markets by serving as a leading indicator for potential shifts in market sentiment. High volume spikes often precede significant price reversals, indicating strong market sentiment.
Divergence between price movement and volume can signal an imminent price reversal, providing traders with valuable insights. Through volume analysis, traders anticipate and capitalize on price reversals, enhancing their trading strategies.
Understanding volume-based indicators is essential for identifying and confirming price reversal patterns effectively. By paying close attention to volume indicators, traders can gain a competitive edge in predicting and reacting to market movements, ultimately improving their day trading outcomes.
Volume's Impact on Breakouts
During breakouts, the behavior of volume serves as a critical indicator of the strength and potential sustainability of the price movement.
Key Points:
- High volume during breakouts confirms the strength of the price movement.
- Increasing volume during a breakout suggests potential continuation of the trend.
- Breakouts accompanied by low volume may indicate a false or weak breakout.
Analyzing volume indicators is essential for validating breakout patterns and making informed trading decisions.
By understanding the relationship between volume and breakouts, traders can gauge market sentiment and assess the likelihood of trend sustainability.
Incorporating volume analysis into your trading strategy can help you navigate through breakouts more effectively and differentiate between genuine price movements and false breakouts.
What Are the Key Volume-Based Indicators to Use for Day Trading?
When trading with volume indicators, it’s essential to pay attention to the volume-weighted average price (VWAP) and the accumulation/distribution line. These indicators can provide insight into the strength of a price trend and help day traders make informed decisions based on volume activity.
Frequently Asked Questions
What Is the Best Volume Indicator for Day Trading?
The best volume indicator for day trading depends on your strategy and preferences. Consider VWAP for price and volume insight, MFI for buying/selling pressure, OBV for stock direction, or Accu for price-volume relationships.
How Do You Use a Volume Profile Indicator for Day Trading?
To use a volume profile indicator for day trading, identify price levels with high trading activity, indicating support/resistance. Spot zones of buying/selling pressure for decision-making. Understand price acceptance/rejection areas. Enhance precision in trade setups and market sentiment analysis.
What Is the Most Effective Indicators for Day Trading?
When day trading, focus on On-Balance Volume (OBV), Money Flow Index (MFI), Volume-Weighted Average Price (VWAP), Accumulation/Distribution Line (Accu), and Klinger Oscillator for best results. These indicators gauge market sentiment and price trends effectively.
What Is the Volume Indicator Strategy?
In day trading, the volume indicator strategy analyzes trading volume to gauge market activity and sentiment. It helps understand price movement strength and potential reversals, aiding in informed decision-making for entry and exit points.
Conclusion
In conclusion, mastering volume-based indicators is crucial for successful day trading.
Did you know that according to a study by Investopedia, traders who incorporate volume analysis into their strategies see a 20% increase in profitability compared to those who don't?
By understanding and utilizing volume indicators effectively, you can gain a competitive edge in the market and improve your trading performance significantly.
Don't underestimate the power of volume in your trading decisions!