
The Williams %R indicator's significance in stock trading lies in its capacity to pinpoint critical market conditions. As traders seek to navigate the complexities of the financial markets, this tool offers a strategic advantage by highlighting potential entry and exit points based on price momentum.
By understanding how this indicator functions and the insights it can provide, traders can position themselves more effectively in the market. However, the true value of the Williams %R indicator unfolds when combined with other technical analysis tools. This synergy can provide a more comprehensive view of market dynamics, ultimately aiding traders in making informed decisions.
Advantages of Williams %R Indicator
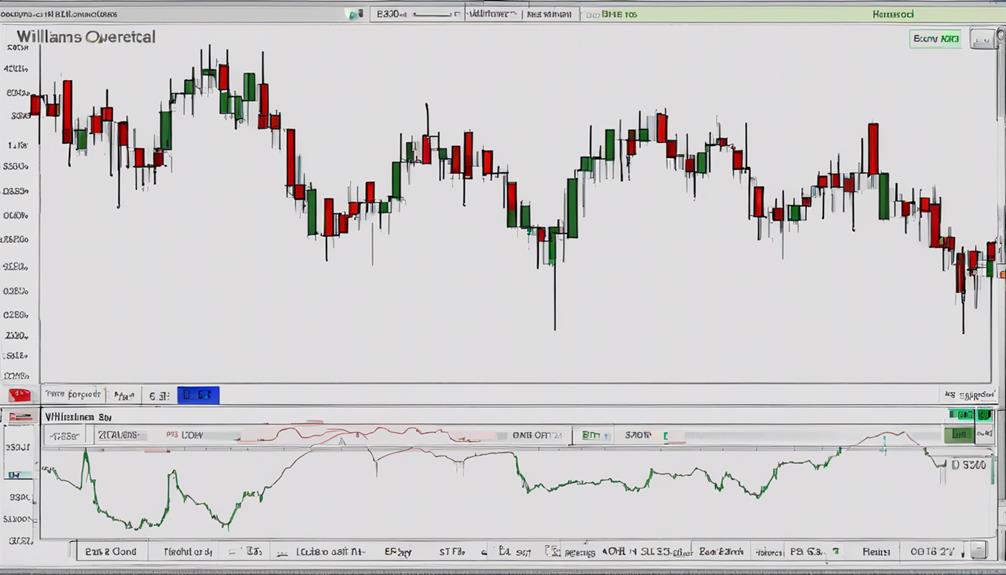
The Williams %R indicator offers significant advantages in stock trading by accurately pinpointing overbought and oversold conditions. This technical indicator, similar to the Stochastic oscillator, operates within a range of 0 to -100, with readings above -20 indicating overbought conditions and readings below -80 signaling oversold conditions.
By utilizing price momentum, the Williams %R provides traders with precise entry and exit signals, helping them make informed decisions regarding potential trend changes. Its versatility allows for application across various timeframes and financial instruments, enhancing its adaptability in different trading scenarios.
The indicator's ability to identify overbought and oversold levels aids traders in anticipating possible reversals or continuations in trends, providing valuable insights for strategic trading decisions. Additionally, when combined with other technical indicators, the Williams %R can strengthen trading signals and improve overall decision-making processes in stock trading.
Interpreting Williams %R Signals
When analyzing Williams %R signals, traders can leverage its ability to indicate potential market reversals and buying opportunities based on overbought and oversold conditions. Williams %R values above -20 suggest overbought levels, indicating a possible reversal in stock prices, while readings below -80 signal oversold conditions, presenting potential buying opportunities.
This indicator helps traders identify extreme price levels, offering insights into the strength of a trend and aiding in understanding market sentiment. By interpreting signals from Williams %R, traders can anticipate potential price movements and make informed decisions regarding trend reversals or continuations in stock trading.
The indicator's effectiveness lies in its ability to highlight overbought and oversold levels, providing valuable information for traders looking to navigate the complexities of the market and capitalize on profitable opportunities.
Implementing Williams %R in Trading
Implementing Williams %R in trading involves strategically utilizing its signals to identify optimal entry and exit points based on overbought and oversold conditions in stocks. Traders can effectively use this indicator by following these key steps:
- Utilize Williams %R to identify overbought and oversold conditions in the market.
- Generate trade signals for entry and exit points based on movements in and out of these territories.
- Combine Williams %R with other technical indicators such as moving averages or support/resistance levels to enhance trading signals.
- Implement the indicator in volatile market conditions to capture potential price reversals or continuations.
- Confirm Williams %R signals with additional indicators to improve decision-making accuracy and avoid false signals.
Williams %R Vs. Other Indicators
Comparing Williams %R with other technical indicators provides traders with valuable insights into market momentum and potential entry and exit points. Williams %R differs from the Stochastic oscillator by comparing the closing price to the highest high instead of the lowest low.
While the Stochastic oscillator ranges from 0 to 100, Williams %R ranges from 0 to -100, indicating overbought conditions above -20 and oversold conditions below -80. The calculation of Williams %R involves subtracting the closing price from the highest high and dividing it by the high-low range.
Both Williams %R and Stochastic indicators assist in identifying potential entry and exit points based on momentum. Williams %R can be used alongside other technical indicators to provide a comprehensive analysis of stock trading, considering factors like relative strength, volume, price, and the specific look-back period in which the indicator moves.
Real-Life Application of Williams %R
The practical application of Williams %R in real-life stock trading scenarios offers traders a valuable tool for identifying potential trend reversals and making informed entry and exit decisions. When applying the Williams Percent Range indicator, traders can:
- Calculate the Williams %R value over a specified period to determine if the price is near oversold or overbought conditions.
- Use the indicator to signal a potential trend reversal when the price is near the lowest lows or highest highs of its recent relative to the highest high.
- Develop a strategy based on Williams %R movements to generate entry and exit points in alignment with the market sentiment.
- Enhance trading decisions by combining Williams %R with other technical indicators to increase accuracy in forecasting potential price movements.
- Leverage the insights provided by Williams %R to gauge market sentiment and anticipate potential price reversals or continuations.
What are the Benefits of Using Advanced Techniques in Williams %R Indicator for Stock Trading?
Using advanced Williams %R techniques for stock trading can provide several benefits. These techniques can help traders identify overbought and oversold conditions more accurately, anticipate potential price reversals, and make more informed trading decisions. By understanding and utilizing these advanced techniques, traders can enhance their trading strategies and improve their overall profitability.
Frequently Asked Questions
What Is the Use of Williams R Indicator?
Williams %R indicator is crucial for assessing overbought and oversold market conditions. It helps traders identify potential trading opportunities by signaling when a stock may be reaching extreme levels, indicating possible reversals or continuations in trends.
How Do You Trade With Williams R?
To trade with Williams %R, monitor levels below -80 for long positions and above -20 for short positions. Combine it with other indicators for enhanced signals. Analyze divergence/convergence and choose a suitable look-back period for accurate signals and trading strategies.
What Is the Difference Between RSI and Williams R Indicator?
The primary distinction between RSI and Williams %R lies in their reference points for identifying overbought and oversold conditions. RSI evaluates average gains/losses, while Williams %R compares closing price to the highest high, offering unique perspectives on momentum analysis.
Is the Williams Indicator Good?
The Williams %R indicator is a valuable tool for traders seeking to gauge market conditions accurately. It provides insights into overbought and oversold levels, aiding in decision-making processes. When used effectively, the indicator can enhance trading strategies significantly.
Conclusion
In conclusion, the Williams %R indicator offers traders a valuable tool for identifying potential entry and exit points in the stock market. By utilizing this momentum indicator, investors can enhance their decision-making process and improve trading outcomes.
Its ability to pinpoint overbought and oversold conditions, combined with other technical indicators, can provide a comprehensive analysis for successful trading strategies. Ultimately, incorporating the Williams %R indicator into trading practices can lead to more informed and profitable investment decisions.