
You may not realize that the Advance Decline Line can offer valuable insights beyond just tracking stock advancements and declines.
Understanding the nuances of this indicator can provide you with a deeper understanding of market dynamics and potential opportunities.
As you explore the three best ways to utilize the Advance Decline Line for market analysis, you'll uncover strategies that can help you navigate bullish trends, detect bearish signals, and evaluate overall market strength.
These insights could be the key to enhancing your market analysis toolkit and making more informed trading decisions.
Interpreting Bullish Trends
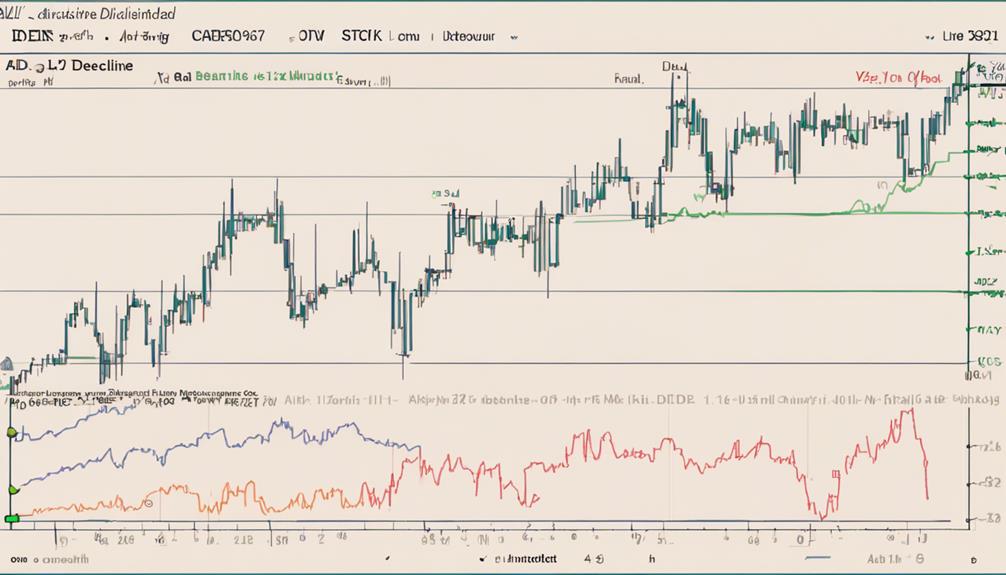
Interpreting bullish trends involves analyzing the relationship between the Advance Decline Line (AD Line) and index prices to gauge market sentiment and potential growth opportunities.
A rising AD Line alongside increasing index prices confirms a bullish trend, indicating positive market breadth and participation. Positive market sentiment is reflected when more stocks are advancing than declining, signifying market strength and potential rallies.
Bullish divergence, seen when the AD Line rises while the stock index falls, hints at a possible trend reversal to the upside. Monitoring the AD Line for confirmation of bullish trends is essential for making informed decisions and identifying favorable market opportunities.
Understanding these dynamics can help you navigate the market with confidence and capitalize on potential growth prospects.
Detecting Bearish Signals
When analyzing market trends, detecting bearish signals becomes crucial for anticipating potential downturns and managing risk effectively.
To effectively identify bearish signals using the Advance Decline (AD) Line, consider the following:
- Look for weakness in the AD Line while prices are rising.
- Historical examples like the dot-com bubble and the 2008 crisis emphasize the importance of recognizing bearish divergence.
- Monitoring volume trends can help confirm or negate bearish signals identified by the AD Line.
What Are the Best Ways to Use the Advance Decline Line for Market Analysis?
When using market analysis, the advance decline line indicator helps identify market strength by tracking the number of advancing and declining stocks. It can be used to confirm price trends and identify potential trend reversals. The best ways to use this indicator include identifying overbought and oversold conditions and analyzing divergences.
Can the Advance Decline Line and Chaikin Money Flow Indicator be Used Together for Market Analysis?
Yes, mastering stock analysis with Chaikin Money Flow Indicator and the Advance Decline Line can enhance market analysis. Together, they offer a comprehensive view of market strength and potential trends. By analyzing both indicators, traders can make more informed investment decisions and improve their overall market analysis strategy.
Evaluating Market Strength
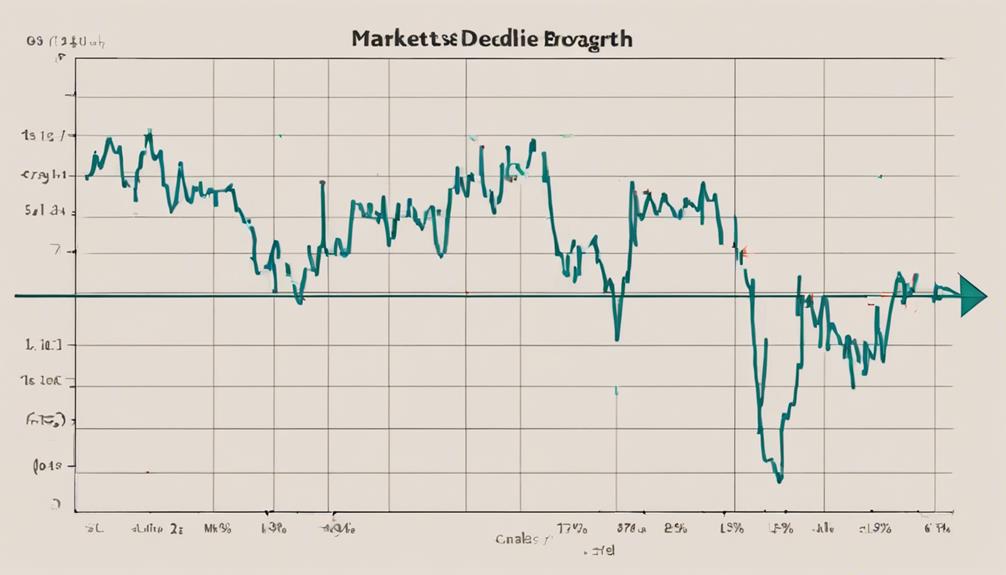
To effectively gauge the strength of the market, regularly assessing the Advance Decline (AD) Line can provide valuable insights into overall market breadth and sentiment. The AD Line measures the difference between advancing and declining stocks, serving as a market breadth indicator.
A rising AD Line signifies positive market sentiment and potential growth, indicating more stocks are advancing than declining. It acts as a leading indicator for index performance, aiding in trend identification and potential reversal points. Historical events like the dot-com bubble and the 2008 crisis demonstrate how a weakening AD Line during rising prices can foreshadow market corrections.
Utilizing the cumulative AD Line offers a long-term view of market strength, assisting in trend prediction, but it's advisable to complement it with other technical indicators for confirmation.
Frequently Asked Questions
How Do You Use Advance-Decline Line Indicator?
To use the advance-decline line indicator effectively, you must analyze market sentiment through stock movements. It reveals shifts in market strength, potential reversals, and divergence signals. Stay vigilant for clues on market direction and trends.
How Do You Use Ad Line?
To use AD Line effectively, monitor it regularly for trends and reversals. Combine it with other indicators for better analysis. By tracking advancing and declining stocks, you can gain valuable insights into market sentiment and make informed trading decisions.
Is the Advance Decline Index a Good Indicator of the Strength of a Bull or Bear Market?
Yes, the Advance Decline Index is a reliable indicator of bull or bear market strength. A rising index signals a strong bull market with broad participation, while a falling index suggests weakening breadth and potential bearish sentiment.
What Is the Advance-Decline Line for the S&P?
The Advance-Decline Line for the S&P tracks the difference between advancing and declining stocks in the index. It offers a snapshot of market breadth, indicating broad market strength when rising and weakening participation when falling.
Conclusion
Just as a skilled sailor uses the stars to navigate the vast ocean, adept traders harness the power of the Advance Decline Line to navigate the turbulent waters of the market.
By interpreting bullish trends, detecting bearish signals, and evaluating market strength, traders can steer their portfolios towards success like a masterful captain guiding their ship to safe harbor.
The Advance Decline Line serves as a beacon of light in the darkness of uncertainty, illuminating the path to profitable trading strategies.