
To effectively navigate trend-following indicators, you must first grasp the fundamentals of key indicators and trend types.
Once you've established this foundation, the next step involves interpreting signals accurately to make informed decisions.
Lastly, implementing these indicators strategically in your trading approach can significantly enhance your success in the market.
By following these three simple steps, you will be better equipped to navigate the complexities of trend following and potentially improve your trading outcomes.
Understanding Trend Following Indicators
In the realm of trading, a solid grasp of trend-following indicators is fundamental for effectively navigating market trends and making strategic decisions.
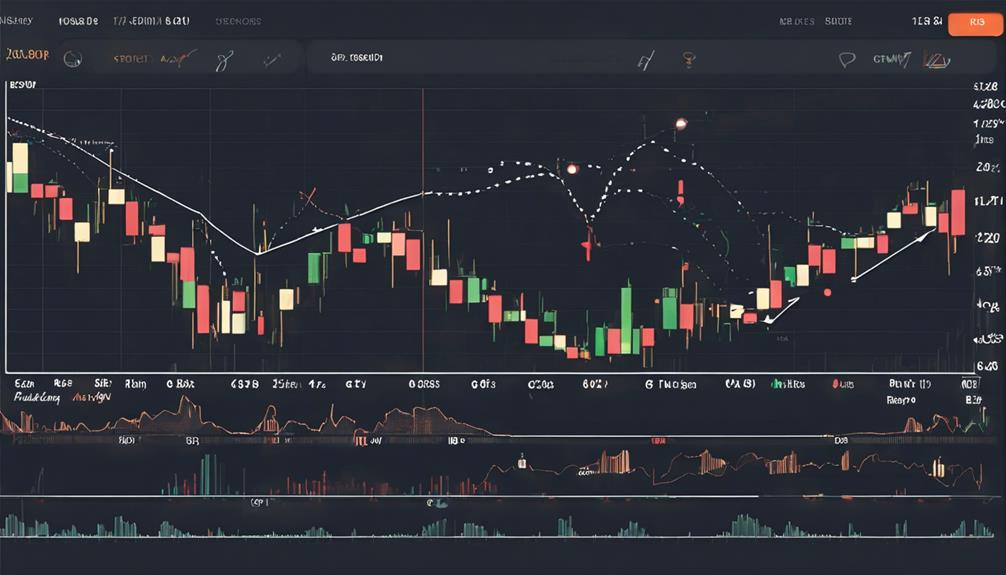
Moving averages offer insight into trend direction by smoothing out price fluctuations over a specified period.
MACD plays a crucial role in identifying potential buy or sell opportunities through crossovers and divergences between different moving averages.
Additionally, Parabolic SAR assists in confirming trend direction and providing reversal signals in robust trending markets.
Understanding these trend-following indicators is essential for traders to interpret market trends accurately and make informed decisions.
Interpreting Indicator Signals
Transitioning from understanding trend-following indicators to interpreting indicator signals is essential for making informed trading decisions. To do so effectively, you must grasp the nuances of each signal's calculation and significance. Indicator signals, such as crossovers and moving averages, provide buy or sell opportunities, but their reliability depends on factors like signal strength and confirmation from multiple indicators.
When interpreting signals, it's crucial to consider market conditions and historical analysis to assess their effectiveness. Conflicting signals from different indicators may require additional confirmation for sound decision-making. By delving into the details of indicator calculation and understanding the context in which signals occur, you can enhance your ability to navigate the complexities of trend-following strategies and optimize your trading outcomes.
Implementing Indicator-Based Strategies
When crafting effective indicator-based strategies, meticulous attention to specific indicator parameters and settings is paramount for accurate signal interpretation and successful trading outcomes. Utilizing technical indicators such as moving averages, MACD, and RSI indicators can help generate buy and sell signals in trend following strategies.
Combining multiple indicators can enhance signal reliability and confirm trading decisions. Backtesting these strategies with historical data is essential to evaluate their performance and fine-tune settings for optimal results.
Implementing proper risk management techniques is crucial to mitigate potential losses and safeguard capital while trading based on indicator signals. By integrating these aspects, traders can enhance their ability to execute profitable trades using indicator-based strategies.
What Are Some Additional Steps for Effectively Using Trend Following Indicators?
When using essential trend following indicators, it’s crucial to also consider market volatility and volume. Incorporating additional confirmation signals, such as price action or fundamental analysis, can help validate the indicator’s signals. Implementing proper risk management strategies is also essential for effectively using trend following indicators.
Frequently Asked Questions
What Is a Simple Trend-Following Strategy?
A simple trend-following strategy involves identifying and following the prevailing market trend. It focuses on buying during uptrends and selling during downtrends to capitalize on price movements. Traders rely on technical indicators for informed decisions.
How Do You Identify a Trend With an Indicator?
You spot trends by noting when the indicator line either rises above a specific level or falls below a key moving average. Sideways trends show as a horizontal indicator line. Crossovers like the MACD and signal line help signal trend shifts.
What Is the Best Way to Determine Trend Direction?
To determine trend direction effectively, analyze moving averages for crossovers and trend confirmation. Use indicators like ADX, Parabolic SAR, and Alligator for additional validation. Combining various indicators gives a comprehensive view of trends and potential reversals.
How Do You Learn Trend-Following?
To learn trend-following, immerse yourself in key indicators like moving averages, MACD, and Bollinger Bands. Practice on historical data to spot trends and opportunities. Interpret signals, combine indicators, and engage in real-time scenarios for hands-on experience.
Conclusion
As you navigate the complex world of trend-following indicators, remember that these tools are like a compass guiding you through the vast ocean of the market.
By understanding, interpreting, and implementing these indicators effectively, you can steer your trading ship towards success and ride the waves of trends with confidence.
Stay focused, stay disciplined, and let the indicators be your guiding stars in the vast sea of market opportunities.