
In the dynamic world of trading, understanding volatility indicators is paramount for informed decision-making. As traders navigate the complexities of the market, these indicators serve as essential tools to gauge potential price fluctuations and assess risk levels.
By delving into the intricacies of various volatility indicators like Bollinger Bands, Donchian Channels, and Ichimoku Clouds, traders can gain valuable insights into market behavior and trends. The nuanced nature of these indicators offers a wealth of information that can shape trading strategies and optimize outcomes.
By exploring the depths of volatility indicators, traders unlock a world of possibilities in the realm of financial markets.
Bollinger Bands Overview
Originally developed by John Bollinger in the early 1980s, Bollinger Bands are a fundamental tool for assessing market volatility. Consisting of three lines – a simple moving average, an upper band, and a lower band – these bands dynamically adjust based on the levels of volatility in the market. When the bands are close together, it suggests low volatility, while wider bands indicate higher volatility levels.
The upper band represents the statistical measure of high prices, while the lower band signifies low prices. Traders utilize Bollinger Bands to identify potential shifts in market volatility, providing insights into potential trading opportunities. By observing the interaction between the price and the bands, traders can make informed decisions about entering or exiting positions.
Understanding Bollinger Bands is crucial for traders seeking to navigate the ever-changing landscape of market volatility and capitalize on price movements effectively.
Exploring Donchian Channels
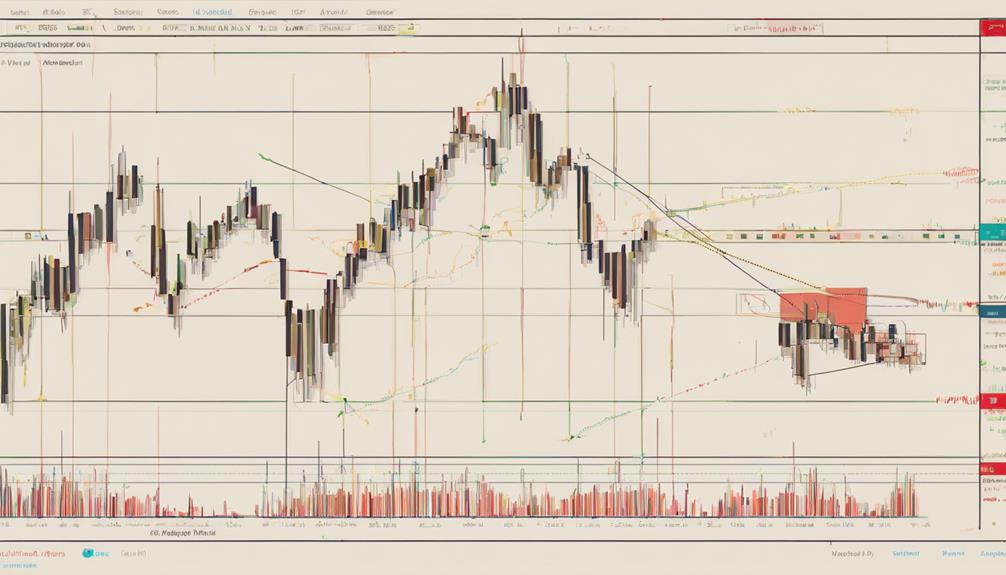
Building on the foundation of Bollinger Bands as a key tool for assessing market volatility, Donchian Channels, developed by Richard Donchian, offer traders a structured approach to identifying price extremes and trends within the market. These channels consist of three bands: the upper band, representing the highest high over a specified period; the lower band, depicting the lowest low in the same period; and the mid-range, which helps traders gauge the market's overall direction.
By focusing on price extremes, Donchian Channels enable traders to spot potential breakouts and reversals, aiding in decision-making processes. Particularly beneficial for short-term traders, Donchian Channels provide a clear visual representation of price movements, allowing for quick analysis and timely actions. Traders use these channels to assess market volatility levels and identify opportunities for entering or exiting trades based on the price action observed within the bands.
Richard Donchian's creation continues to be a valuable tool for traders seeking to navigate dynamic market conditions with precision.
Understanding Keltner Channel Indicators
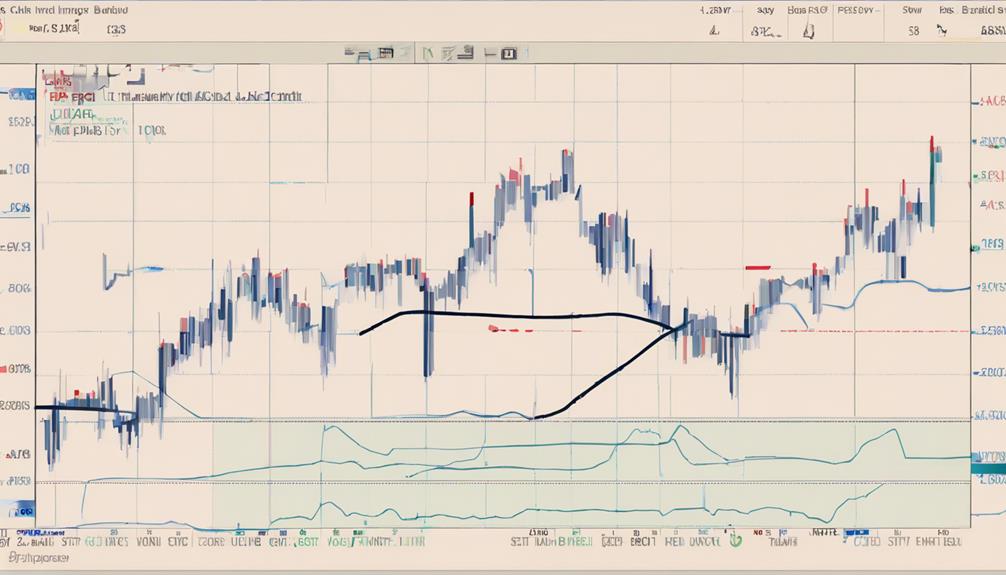
Based on the Average True Range (ATR) to gauge price volatility, Keltner Channel indicators offer traders a comprehensive framework for analyzing market trends and potential reversal points. The three bands – upper, middle, and lower – provide a visual representation of price movements and help identify support and resistance levels.
Here are three key points to understand about Keltner Channels:
- Trend Continuation and Reversal: Keltner Channels assist traders in spotting potential trend continuation or reversal points, indicating shifts in market sentiment.
- Volatility Levels: The bands expand during high volatility periods and contract during low volatility periods, aiding traders in assessing the intensity of price movements.
- Support and Resistance: Traders utilize Keltner Channels to locate crucial support and resistance levels in the market, which can be pivotal for making informed trading decisions.
Insights Into Ichimoku Clouds
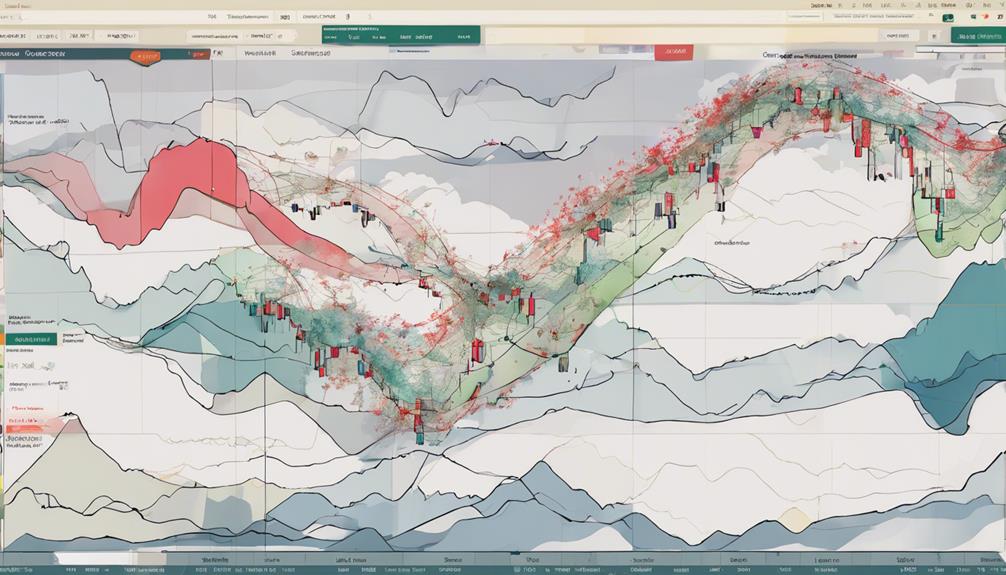
Keltner Channel indicators provide valuable insights into market trends and price movements, and a similar tool that enhances trend analysis and trade opportunities is the Ichimoku Clouds.
Developed by Goichi Hosada in the late 1960s, Ichimoku Clouds use multiple moving averages to create bullish or bearish clouds that signal uptrends or downtrends based on the price position. These clouds offer enhanced trend signals over time, making it easier for traders to confirm trend directions and identify potential trade opportunities.
By utilizing Ichimoku Clouds, traders can gain a comprehensive view of the market trends and price movements, allowing for more informed decision-making. The visual representation of the clouds simplifies the process of identifying market trends, making it a valuable tool in technical analysis.
Analyzing Historical Volatility
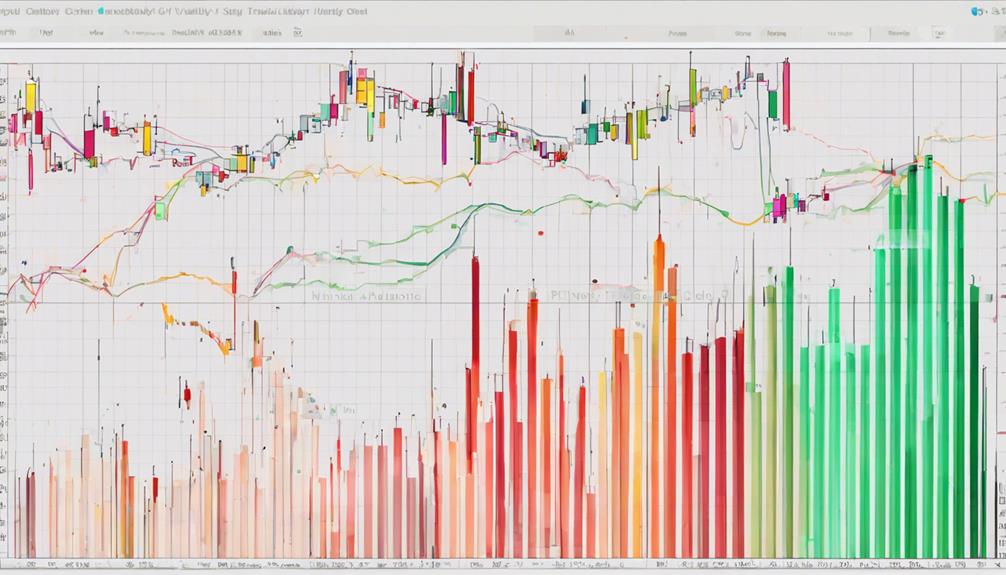
Analyzing historical volatility provides traders with valuable insights into past price fluctuations of an asset over a specific timeframe, aiding in risk assessment and strategic decision-making. When delving into historical volatility, traders should consider the following:
- Calculation Method: Historical volatility is determined by calculating the standard deviation or variance of an asset's historical prices. This method helps quantify the degree of price fluctuation experienced by the asset over a specific period.
- Risk Assessment: High historical volatility signifies larger price swings, indicating higher risk levels. On the contrary, low historical volatility suggests more stable prices and lower risk exposure. Traders can adjust their risk management strategies based on these volatility levels.
- Trading Strategies: Understanding historical volatility enables traders to set appropriate stop-loss orders and fine-tune their trading strategies. By analyzing past price behavior, traders can anticipate potential price movements and adjust their positions accordingly to capitalize on market trends effectively.
Can You Explain the Top Volatility Indicators in More Detail?
Volatility indicators measure the rate of price movement in the market and help traders assess the potential for price fluctuations. Some top volatility indicators include Average True Range (ATR), Bollinger Bands, and Chaikin’s Volatility. Understanding how to use volatility indicators can enhance trading strategies and risk management.
Frequently Asked Questions
What Is the Best Indicator for Volatility?
The best indicator for volatility varies based on individual trading preferences and goals. Bollinger Bands are favored for their ability to gauge volatility through expanding and contracting price bands, while Average True Range (ATR) and Donchian Channels are also widely used for tracking market volatility.
How Does Volatility Indicator Work?
Volatility indicators assess market fluctuations by analyzing price movements. They use mathematical models to gauge volatility levels, aiding traders in risk evaluation and strategy adjustments. While not infallible, these tools offer valuable insights into market conditions.
What Are the 4 Levels of Volatility?
Volatility levels range from low to extreme, representing market stability to intense fluctuations. Low volatility indicates narrow price ranges, while high volatility signifies rapid and significant price changes. Understanding these levels aids traders in adjusting strategies.
How Do You Interpret Volatility Numbers?
Interpreting volatility numbers involves analyzing the degree of price fluctuation in a financial market. Traders use higher volatility numbers to gauge risk and market sentiment, adjusting risk management strategies accordingly. Understanding volatility aids in making informed decisions on entry and exit points.
Conclusion
In conclusion, understanding volatility indicators is crucial for traders to analyze market trends and make informed decisions.
One interesting statistic is that Bollinger Bands, a widely used volatility indicator, have been shown to capture about 90% of price movements, making them a valuable tool for identifying potential entry and exit points in trading strategies.
By utilizing various volatility indicators like Bollinger Bands, Donchian Channels, and Ichimoku Clouds, traders can better navigate the complex dynamics of market volatility.