
If you've ever felt overwhelmed by the intricacies of the Ichimoku Cloud Indicator, this guide is your key to unlocking its potential with ease. By breaking down the components and simplifying its application, you can navigate the complexities of this powerful tool effortlessly.
Discover how to interpret signals, set up parameters, and implement strategies that can elevate your trading game. Stay tuned to uncover practical tips and insights that could transform the way you approach market analysis and decision-making.
Understanding Ichimoku Cloud Components
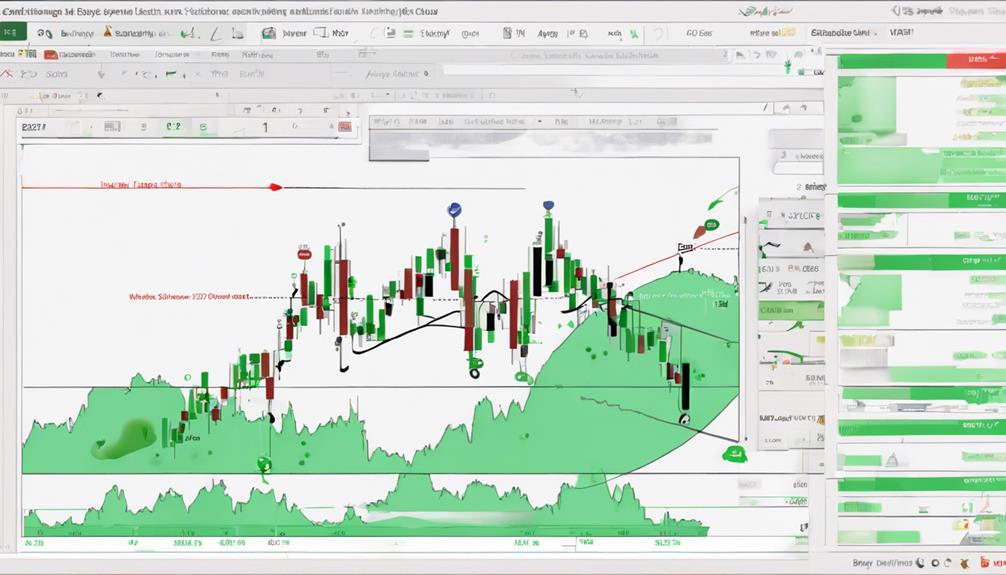
To grasp the essence of the Ichimoku Cloud indicator, delve into its core components for a nuanced understanding of trend analysis. The Ichimoku Cloud comprises various elements crucial for trading decisions.
The Conversion Line (Tenkan-sen) and Base Line (Kijun-sen) form the baseline for trend identification. These lines intersect and diverge, indicating potential trend shifts.
The Lagging Span (Chikou Span) confirms trends by following price movement, providing a retrospective view. Senkou Span A (Leading Span A) gauges trend strength between the Conversion Line and Base Line.
Senkou Span B (Leading Span B) assesses market momentum based on past price action. Together, these components create the Ichimoku Cloud, offering a holistic perspective on price dynamics and trend direction in trading scenarios.
Interpreting Ichimoku Signals
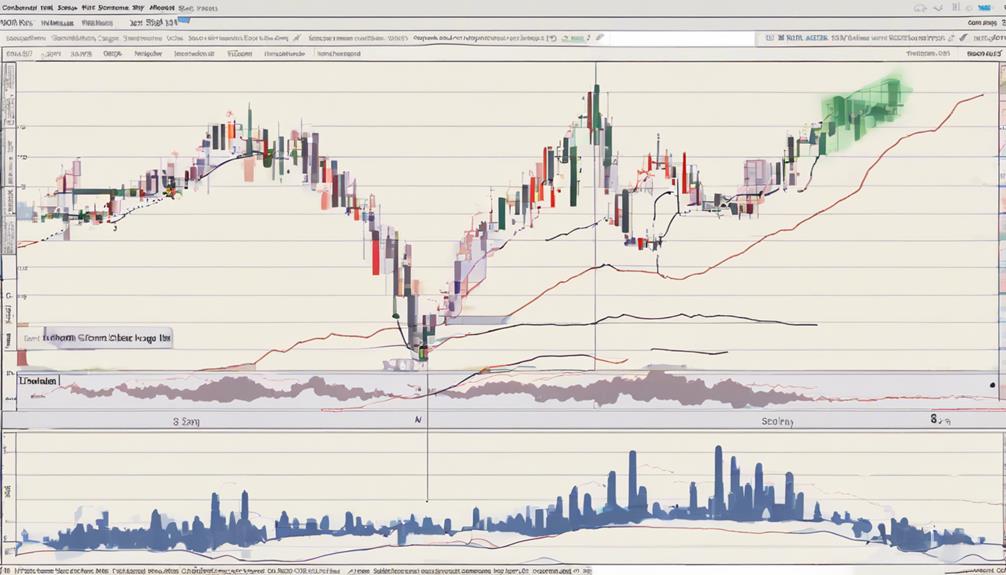
Interpreting Ichimoku signals involves analyzing various indicators to gauge market trends and potential trading opportunities. The Ichimoku cloud chart offers dynamic support and resistance levels.
The Conversion Line crosses above the Base Line signal bullish momentum, while crosses below indicate bearish sentiment. The Chikou Span, lagging behind the price, confirms the trend's strength. RSI trend confirmation complements Ichimoku signals, helping to validate potential reversals.
Kumo breakouts signify potential trend changes, guiding traders on entry and exit points. By combining Ichimoku with RSI, traders can enhance their trend identification and make more informed trading decisions.
The Ichimoku Cloud indicator acts as a comprehensive tool, filtering trends, and offering support/resistance levels for effective market analysis.
Setting Up Ichimoku Parameters
Analyzing market trends using Ichimoku Cloud indicator begins with setting up specific parameters such as the Conversion Line, Base Line, and Lagging Span. Traders often customize these parameters, like using (10, 30, 60) or (20, 60, 120) in the crypto market, to better fit the market dynamics.
The numbers in the parameters reflect different time periods in Japanese business life, giving historical context to the settings. Customizing Ichimoku settings allows for adaptation to the 24/7 nature of the crypto market. However, debates persist about the impact of adjusting parameters on signal stability.
It's crucial to find a balance between customizing settings to suit the crypto market and maintaining the indicator's signal reliability.
Implementing Ichimoku Strategies
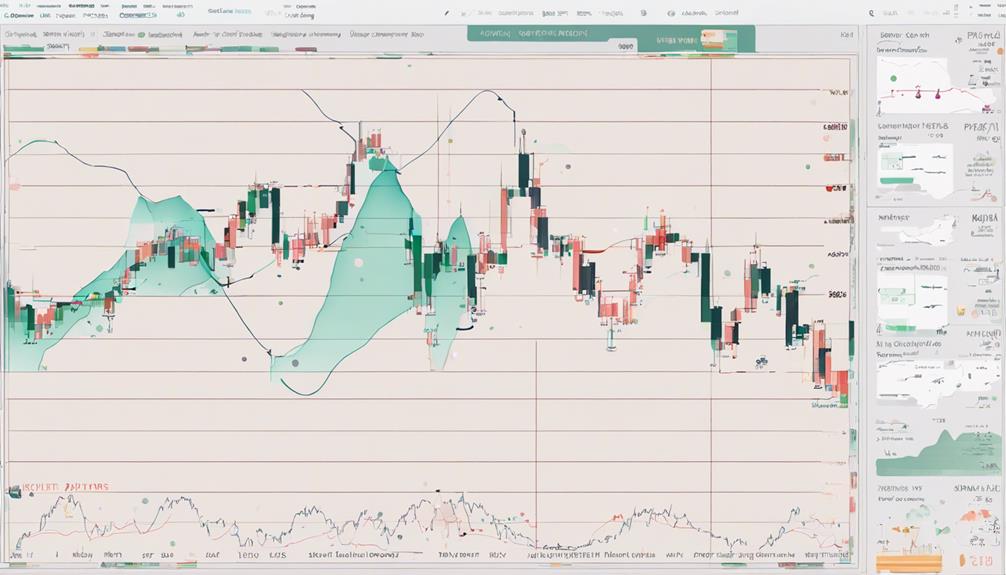
Implement Ichimoku Cloud strategies by utilizing the Conversion and Base lines for trend identification. When the price is above both lines, traders look for bullish signals, indicating a potential uptrend. Conversely, if the price falls below both lines, it confirms bearish signals, suggesting a possible downtrend.
The Ichimoku Cloud aids in recognizing market trends and momentum, assisting in making informed trade decisions. Understanding the relationships between Ichimoku components is crucial for effective strategy implementation. By analyzing the interplay between the Conversion and Base Lines, traders can gain insights into the direction of the trend and the strength of market movements.
Incorporating these elements into your trading approach can enhance your ability to interpret price action accurately.
Enhancing Trading With Ichimoku
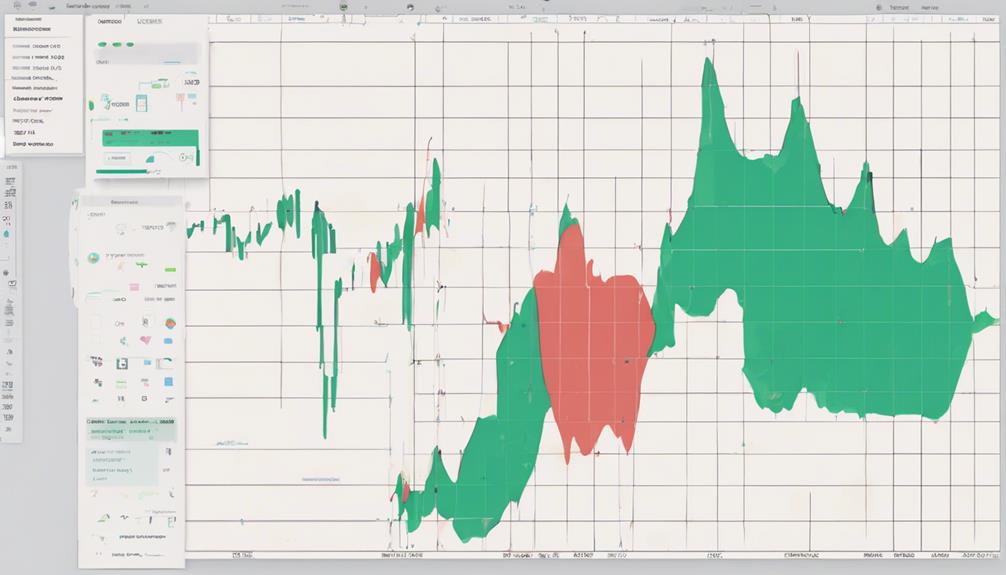
To further optimize your trading strategy with Ichimoku, consider leveraging the dynamic nature of the Cloud color to identify potential market trends efficiently. The Ichimoku Cloud Indicator offers various trading signals such as momentum signals, TK cross, and trend-following signals.
The Chikou Span aids in confirming trend reversals, while Leading Span A serves as either support or resistance depending on the market direction. By observing the Cloud's color, red indicating a downtrend and green signaling an uptrend, you can make informed trading decisions.
Additionally, the position of the market price relative to the Cloud, Conversion Line, and Base Line can help determine the trend. Utilize these components to establish trend lines and capture momentum signals effectively in your trading endeavors.
Can You Provide a Kickstart Guide to Understanding the Ichimoku Cloud Indicator?
The ichimoku cloud indicator simplified is a popular technical analysis tool used in trading. It consists of several components, including the cloud, which represents support and resistance levels. Understanding how to interpret these components can help traders identify potential trend reversals and entry/exit points.
Frequently Asked Questions
Which Indicator Works Best With Ichimoku Cloud?
When trading with the Ichimoku Cloud, the Relative Strength Index (RSI) is an excellent companion. RSI divergences combined with Ichimoku signals can highlight potential trend reversals, offering you a powerful tool for decision-making.
What Is the Best Timeframe for Ichimoku?
For accurate trend analysis with Ichimoku, the daily chart is typically best. Shorter timeframes like the 1-hour or 4-hour work for intraday trades. Longer timeframes such as the weekly offer a broader market view. Choose based on your goals, risk tolerance, and trading frequency to align with your strategy.
What Is the Success Rate of the Ichimoku Cloud Indicator?
In trading, the success rate of the Ichimoku Cloud indicator varies. Understand market conditions, interpret its components well, and combine it with other tools for higher success. Backtesting can help assess effectiveness.
What Is the Formula for Ichimoku Cloud Indicator?
You calculate the Ichimoku Cloud by finding the midpoint of price points over specific periods. This involves components like Conversion Line, Base Line, Leading Span A, Leading Span B, and Lagging Span for detailed analysis.
Conclusion
In the world of trading, the Ichimoku Cloud is like a guiding light in a stormy sea, illuminating the path to profitable trades with its insightful signals and dynamic components.
By simplifying its complexities and harnessing its power, you can navigate the markets with confidence and precision.
With the Kickstart Guide as your compass, you're equipped to conquer the waves of uncertainty and sail towards success in your trading journey.