
As you navigate the intricate waters of trading, mastering the MACD indicator can be likened to having a reliable compass in a stormy sea. By honing in on five practical tips tailored to optimize your MACD application, you can steer your trading journey towards calmer and more profitable shores.
From deciphering crossover signals to fine-tuning parameters and blending MACD with other indicators, these tips offer a strategic roadmap for navigating the complexities of the financial markets. Explore how these insights can help elevate your trading prowess and lead to more informed decision-making that aligns with your unique trading style and objectives.
Understanding MACD Indicator Signals
Have you ever wondered how to interpret the signals of the MACD indicator effectively in your trading strategy?
The MACD indicator provides valuable insights into the market trends. When the blue MACD line crosses above the red signal line, it indicates a bullish trend, suggesting a potential buying opportunity.
Conversely, when the blue line crosses below the red line, a bearish trend is signaled, hinting at a possible selling opportunity.
Monitoring the MACD histogram bars above zero can also help identify bullish momentum. Divergence between price action and the MACD can warn of potential trend reversals.
Furthermore, pay attention to centerline crossovers on the MACD, as they signify shifts between bullish and bearish market conditions.
Setting Optimal MACD Parameters
To optimize your use of the MACD indicator, it's essential to carefully consider and adjust the parameters to suit your trading preferences and market conditions. The default MACD parameters are 12, 26, 9 for the fast EMA, slow EMA, and signal line periods, respectively.
Lowering the fast EMA period increases sensitivity to recent price changes, while raising the slow EMA period smooths out signals for better trend identification. Traders can experiment with different parameter settings to strike a balance between sensitivity and reliability based on their trading style and prevailing market conditions.
Identifying MACD Divergences
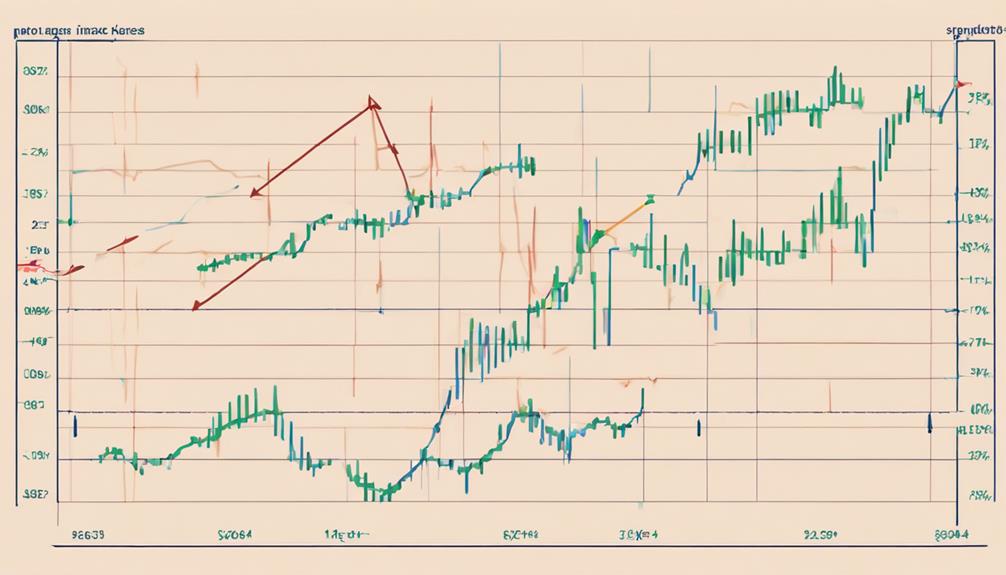
Identifying MACD divergences plays a crucial role in detecting potential trend reversals and understanding market momentum shifts. When analyzing MACD divergences, keep in mind the following:
- Bullish Divergence: Occurs when price forms lower lows while MACD forms higher lows, signaling a possible uptrend.
- Bearish Divergence: Is observed when price creates higher highs while MACD forms lower highs, indicating a potential downtrend.
- Validation: MACD divergences should be confirmed by other technical indicators or price action to make informed trading decisions.
Utilize divergences as early indications of market direction changes, aiding in predicting trend reversals and understanding momentum shifts. By validating MACD signals, you can enhance the accuracy of your trading strategies.
Using MACD With Other Indicators
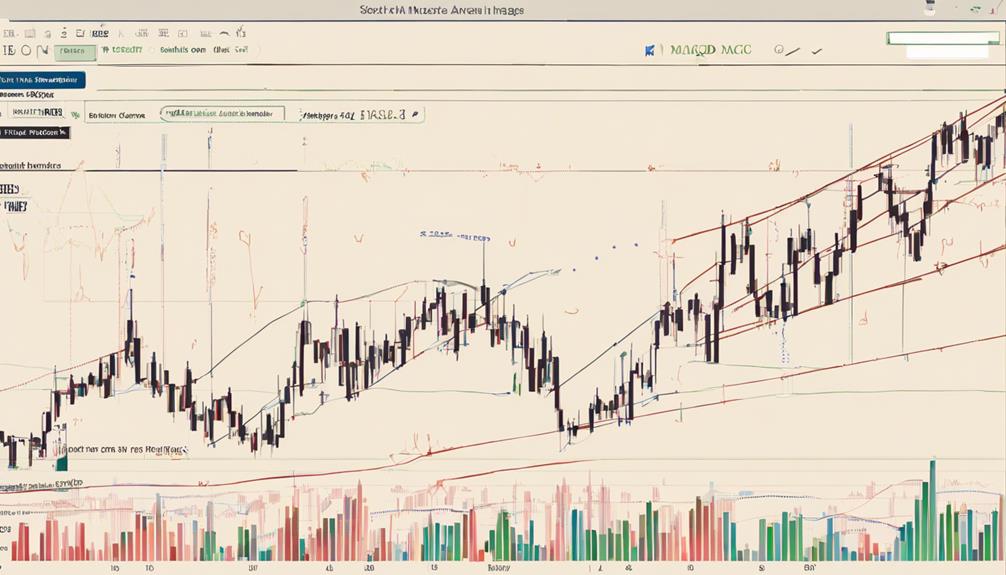
When combining the MACD indicator with other technical tools, traders can enhance signal accuracy and strengthen their trading strategies. Integrating MACD with RSI can validate trading signals and confirm trend strength.
Utilizing MACD alongside Bollinger Bands helps in identifying potential trend reversals and determining entry/exit points. Pairing MACD with Moving Averages provides additional confirmation for trade setups and trend direction.
Combining MACD with the Stochastic Oscillator assists in filtering out false signals, improving decision accuracy. Incorporating MACD with Fibonacci retracement levels enhances precision in pinpointing key support and resistance levels for trades.
These combinations offer traders a comprehensive approach to analyzing market dynamics and making informed trading decisions based on a variety of technical indicators.
Implementing Effective MACD Trading Strategies
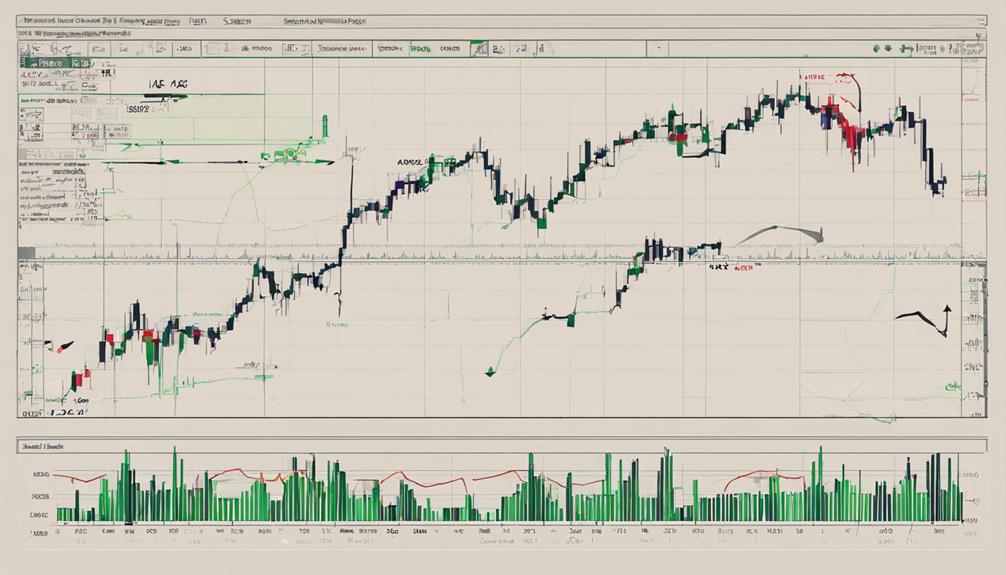
For effective implementation of MACD trading strategies, consider utilizing crossovers to signal potential entry and exit points in your trades. When incorporating MACD into your trading decisions, focus on the following key aspects:
- Divergence Analysis: Use MACD to identify potential trend reversals, providing valuable insights for making informed trading choices.
- Histogram Patterns: Monitor histogram patterns in MACD to gauge market momentum and anticipate possible price movements accurately.
- Centerline Crossovers: Pay attention to centerline crossovers in MACD as they indicate shifts in market sentiment and trend direction, helping you align your trades with the broader market trend for more effective trading decisions.
Can I Use the MACD Indicator Effectively with These Practical Tips?
Yes, you can use the MACD indicator effectively with the help of a comprehensive using the macd indicator tutorial. By learning about the different strategies and practical tips for using this powerful technical analysis tool, you can enhance your trading decisions and improve your overall market performance.
Frequently Asked Questions
How Do You Use MACD Indicator Effectively?
To use the MACD indicator effectively, monitor crossovers on higher timeframes, identify divergence patterns, analyze histogram bars, watch for centerline crossovers, and align analysis with the market trend. These steps can enhance your trading decisions.
How Can I Make My MACD More Accurate?
To make your MACD more accurate, adjust EMA periods for varied market conditions. Combine it with RSI or Stochastic Oscillator for confirmation. Regularly backtest strategies on historical data. Stay updated on market news. Implement risk management techniques.
What Are the 5 Minute MACD Settings?
To optimize your 5-minute MACD settings, consider default periods of 12, 26, 9 for fast analysis. Shorter timeframes like 5 minutes offer active traders more signals. Experimenting with settings can enhance accuracy and responsiveness for day trading.
What Are the Best MACD Indicator Settings?
When setting up your MACD indicator, tailor the parameters to your trading style. Adjusting the short-term, long-term, and signal line periods can enhance sensitivity or smooth out signals. Experiment wisely to find your optimal setup.
Conclusion
In conclusion, mastering the MACD indicator requires a keen eye for crossover signals, divergence patterns, and histogram features.
By setting optimal parameters, identifying divergences, and utilizing it alongside other indicators, you can enhance your trading decisions.
Just like a skilled artist uses different brushes to create a masterpiece, incorporating effective MACD strategies will help you navigate the market with precision and finesse.
Happy trading!