
Navigating the intricacies of the MACD Indicator involves a methodical approach that can enhance your analytical skills in trading. As you begin to unravel the layers of this versatile tool, you'll uncover a structured framework that can potentially boost your decision-making process.
By grasping the fundamental principles and practical applications of the MACD, you'll be equipped to navigate the complexities of the financial markets with more confidence. Understanding the nuances of MACD crossovers, divergences, and histograms is just the beginning of a journey towards more informed trading strategies.
MACD Indicator Basics
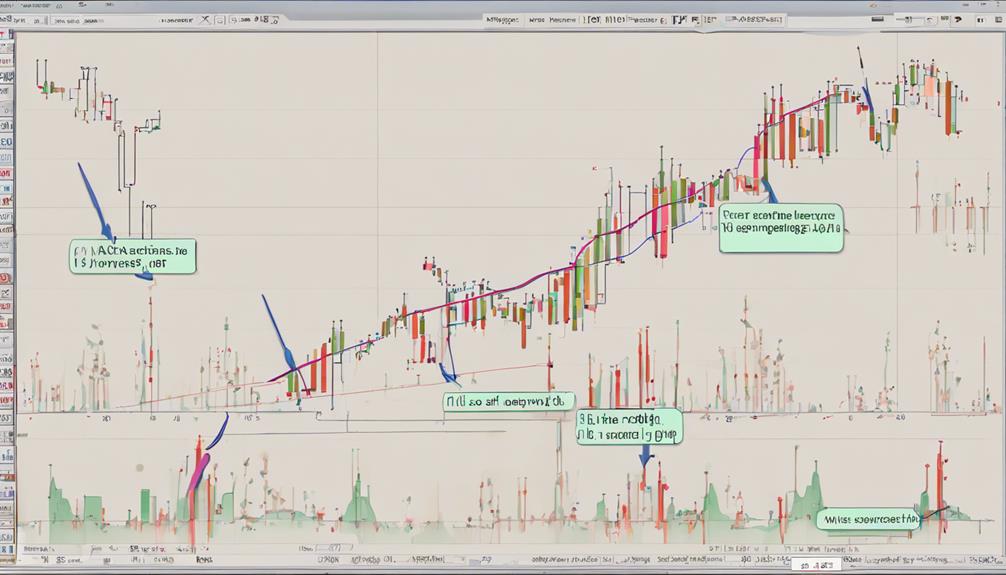
To understand the MACD Indicator Basics, focus on its foundation in the difference between two exponential moving averages (EMAs). The MACD consists of the MACD line, signal line, and histogram, which are essential components for analyzing momentum and trend strength.
Traders pay close attention to MACD crossovers, where the MACD line crosses above or below the signal line, as these indicate potential shifts in trend direction.
The histogram represents the difference between the MACD line and the signal line, providing a visual representation of the relationship between the two. By observing these components, traders can gauge the momentum in the market and make informed decisions regarding entry, addition, or exit strategies based on EMA interactions.
Understanding MACD Formula
The MACD formula calculates the MACD line by subtracting the 26-period EMA from the 12-period EMA. This computation highlights the relationship between these exponential moving averages.
When the 12-period EMA is above the 26-period EMA, positive MACD values indicate bullish momentum. Conversely, negative MACD values occur when the 12-period EMA is below the 26-period EMA, signaling bearish momentum.
Understanding the MACD formula is crucial for identifying potential trend changes and reversals in the market. The MACD line, derived from the EMA variance, provides insights into the strength and direction of price movements.
The subsequent 9-day EMA of the MACD line acts as the signal line, aiding in decision-making for buy or sell signals.
Interpreting MACD Crossovers
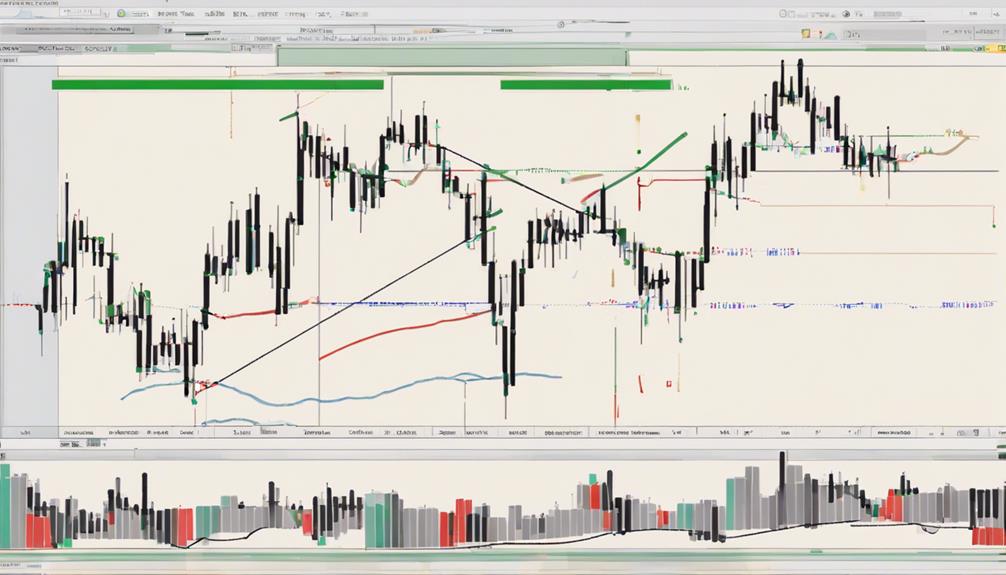
Interpreting MACD Crossovers involves analyzing the points at which the MACD Line crosses the Signal Line. A bullish crossover, where the MACD Line moves above the Signal Line, may signal a potential price increase, indicating a buy opportunity. Conversely, a bearish crossover, when the MACD Line falls below the Signal Line, could indicate a potential price decrease, suggesting a sell opportunity.
MACD crossovers are used by traders to interpret momentum shifts and identify changes in trends. As a momentum oscillator, the MACD helps traders recognize potential support and resistance levels. However, it's essential to be cautious as false signals can occur, highlighting the importance of considering other factors before making trading decisions based solely on MACD signals.
Identifying MACD Divergence
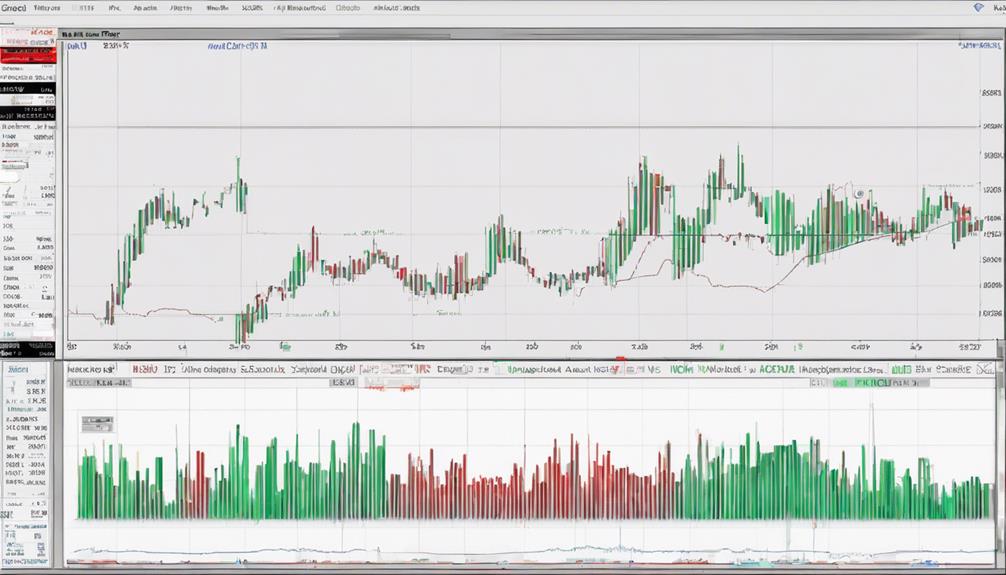
When identifying MACD Divergence, observe instances where the price trend deviates from the MACD indicator trend. This disparity can signal potential trend reversals or shifts in momentum.
Here's what to look for:
- Bullish Divergence: Price makes lower lows, while the MACD makes higher lows, indicating a possible upward movement.
- Bearish Divergence: Price makes higher highs, but the MACD makes lower highs, suggesting a potential downward shift.
- Trading Signals: MACD Divergence at key price levels can offer valuable insights for making informed trading decisions.
Applying MACD in Trading
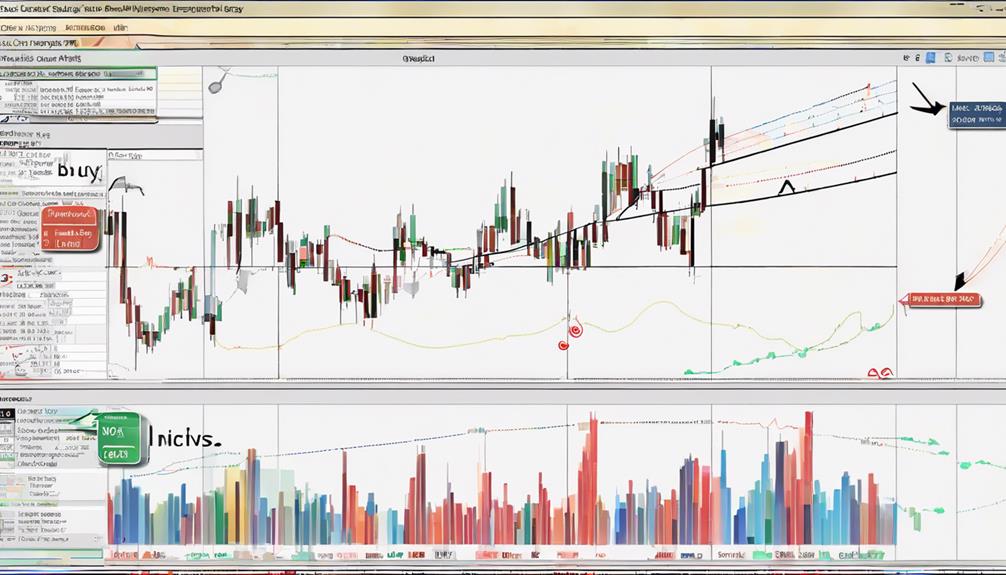
To effectively utilize the MACD indicator in trading, consider its dynamic application for assessing changes in market momentum and trend strength. The MACD consists of two lines: the MACD line and the Signal line, where a crossover indicates potential buy or sell signals.
Utilizing the Exponential Moving Average (EMA) of the MACD can help traders confirm trends and identify entry/exit points based on price action. When the MACD line crosses above the Signal line, it suggests a bullish trend, while the opposite indicates a bearish trend.
Traders can also use the histogram to identify the momentum of these crossovers. Combining MACD with other technical indicators can enhance trading strategies by providing more comprehensive analysis for informed decision-making.
Can Beginners Easily Understand and Use the MACD Indicator with Your Step-by-Step Guide?
Yes, beginners can easily understand and use the MACD indicator with our step-by-step guide on how to navigate MACD indicator steps. Our simple and clear instructions will help you grasp the concept and make informed trading decisions. Master the MACD indicator with ease and confidence.
Frequently Asked Questions
How Do You Use MACD for Beginners?
To use MACD as a beginner, focus on understanding how it gauges momentum and trend direction by comparing EMAs. Look for crossovers and divergences to pinpoint potential entry and exit points for trading strategies.
How Do You Use the MACD Indicator on a Chart?
To use the MACD indicator on a chart, subtract the 26-period EMA from the 12-period EMA to get the MACD Line. The Signal Line, a 9-day EMA of the MACD Line, helps generate buy/sell signals. Analyze these components for informed decisions.
What Is the Best Strategy to Use With Macd?
For the best strategy using MACD, focus on trend-following by monitoring crossovers and divergences for entry and exit signals. Enhance effectiveness by combining MACD with indicators like RSI, and analyze price action for trend confirmation.
How Do I Use MACD to Buy and Sell?
To use MACD for buying, watch for the MACD Line to rise above the Signal Line, indicating a bullish trend. For selling, observe the MACD Line dipping below the Signal Line, signaling a bearish trend. Confirm signals with crossovers and trend analysis.
Conclusion
In conclusion, mastering the MACD indicator can greatly enhance your trading strategies.
By understanding its basics, interpreting crossovers, identifying divergences, and applying it effectively in your trades, you can make informed decisions and capitalize on market trends.
Remember, the MACD is just one tool in your trading arsenal, so be sure to confirm signals with other indicators for optimal results.
Keep honing your skills and stay ahead of the curve in the dynamic world of trading.