
You might think the Ichimoku Cloud Indicator looks complex at first glance, with its multiple lines and calculations. However, understanding the key components and how they interact can help simplify its interpretation.
By breaking down each element, such as the Tenkan Sen and Senkou Spans, you can gain valuable insights into market trends and potential entry or exit points.
Delve deeper into how these components work together to unlock the power of this indicator in your trading strategy.
Key Components of Ichimoku Cloud
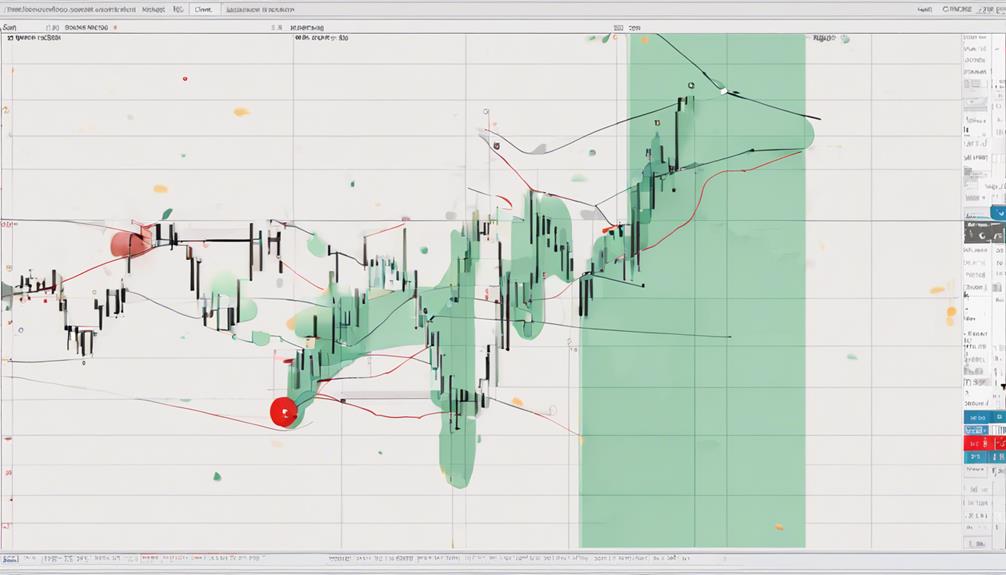
When analyzing the Ichimoku Cloud indicator, understanding its key components is crucial for interpreting market trends effectively. The Ichimoku Cloud comprises various elements such as Tenkan-sen, a 9-period moving average, and Kijun-sen, a 26-period moving average.
Additionally, Senkou Span A is calculated by averaging the Conversion and Base Lines projected 26 periods ahead, while Senkou Span B is a 52-period moving average projected 26 periods ahead. The Kumo, also known as the Cloud, represents the area between Senkou Span A and Senkou Span B and serves as a key indicator of support and resistance levels.
The Chikou Span, or Lagging Span, shows the closing price of the current period projected 26 periods in the past, completing the comprehensive set of components that help determine market trends.
Simplified Interpretation of Tenkan Sen
For a clearer insight into market trends, understanding the simplified interpretation of Tenkan Sen is essential. Tenkan Sen, a 9-period moving average based on high and low prices, focuses on short-term price momentum and trend reversals. It offers a quicker response to price changes than Kijun Sen, making it a valuable tool for traders.
When the Tenkan Sen crosses above the Kijun Sen, it signals a potential bullish trend. This simplified interpretation of Tenkan Sen streamlines trend analysis by providing a concise view of short-term price movements.
Enhancing Analysis With Senkou Spans
Enhance your market analysis by incorporating Senkou Spans, essential components of the Ichimoku Cloud indicator.
- Senkou Span A: Calculated by averaging the Conversion Line and Base Line, projecting it 26 periods into the future.
- Senkou Span B: Determined by averaging the highest high and lowest low over the past 52 periods, projected 26 periods ahead.
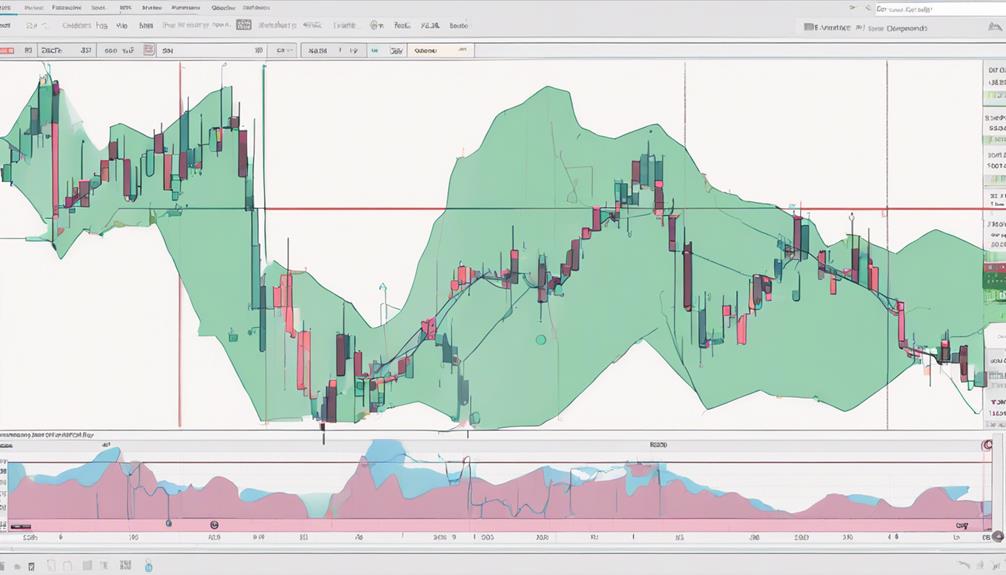
- The space between Senkou Span A and Senkou Span B forms the cloud, providing insights into future support and resistance levels.
- Senkou Spans aid in identifying potential trend changes, forecasting price movements, and signaling shifts in market sentiment through analyzing price action within the cloud, offering valuable trading signals.
Leveraging Chikou Span Insights
Moving from the essential components of the Ichimoku Cloud indicator to Chikou Span insights, you can gain further clarity on market sentiment and trend direction.
The Chikou Span reflects the current closing price position in comparison to past price action, helping confirm trend signals by analyzing current price against historical price movement over 26 periods. This element provides a visual representation of market sentiment and trend direction, simplifying analysis by showing potential trend continuation or reversal.
Practical Tips for Ichimoku Cloud Trading
To optimize your trading strategy with the Ichimoku Cloud indicator, consider implementing practical tips that enhance precision and efficiency in your market analysis.
- Utilize Senkou Span A and Senkou Span B to identify future price movements and support/resistance zones effectively.
- Pay close attention to the crossover of the Conversion Line and Base Line, as it signals potential trend changes.
- Regularly review the cloud's color changes to gauge market sentiment and trend strength accurately.
- Combine Ichimoku Cloud analysis with other technical indicators to validate trading signals and enhance overall chart analysis proficiency.
Can you explain what simplifies the Ichimoku Cloud Indicator?
The Ichimoku Cloud Indicator simplifies market analysis by offering a comprehensive view of support and resistance levels, trend direction, and potential buy or sell signals. Traders can understand Ichimoku Cloud Indicator by examining the interaction between the components: the Kumo (cloud), Tenkan Sen, Kijun Sen, and Chikou Span.
Frequently Asked Questions
How to Interpret Ichimoku Cloud?
To interpret the Ichimoku Cloud, identify trends with cloud color. Use crossovers of Tenkan-sen and Kijun-sen for entry/exit signals. Chikou Span validates trends against the cloud. This indicator combines components for a comprehensive analysis, simplifying your trading decisions.
What Is the Best Indicator for Ichimoku Cloud?
When navigating Ichimoku Cloud, focus on Tenkan-sen for short-term momentum insights. Its crossovers with Kijun-sen guide trading decisions. Embrace Tenkan-sen's power, as it not only signals price direction but also influences your buy and sell choices.
What Is the Formula for the Ichimoku Indicator?
To calculate the Ichimoku Indicator, combine the Conversion Line, Base Line, Leading Span A, Leading Span B, and Lagging Span. Leading Span A averages the Conversion and Base Lines projected 26 periods ahead. Leading Span B uses a 52-period moving average projected 26 periods ahead.
How Accurate Is Ichimoku Cloud Indicator?
You'll find the Ichimoku Cloud indicator impressively accurate in forecasting market trends and key levels. Its unique blend of components simplifies analysis, providing traders with clear signals for precise entries and exits.
Conclusion
In conclusion, the Ichimoku Cloud Indicator simplifies complex market analysis with its unique composition of five interconnected lines. By providing clear signals and forecasting future support/resistance levels, it becomes a valuable tool for traders.
Its innovative design, along with practical tips for trading, makes it a must-have for technical analysis enthusiasts. Embrace the power of the Ichimoku Cloud and watch your trading skills soar to new heights with ease and precision.