
If you've ever wondered how the Ichimoku Cloud Indicator can improve your trading success, you're not alone. With its popularity steadily rising, understanding this indicator can significantly enhance your market analysis skills.
By following a few simple steps, you can unlock the full potential of the Ichimoku Cloud in your trading endeavors.
So, let's explore how breaking down its components and learning its unique formulas can pave the way for more informed decision-making in your trading strategies.
Key Components of Ichimoku Cloud
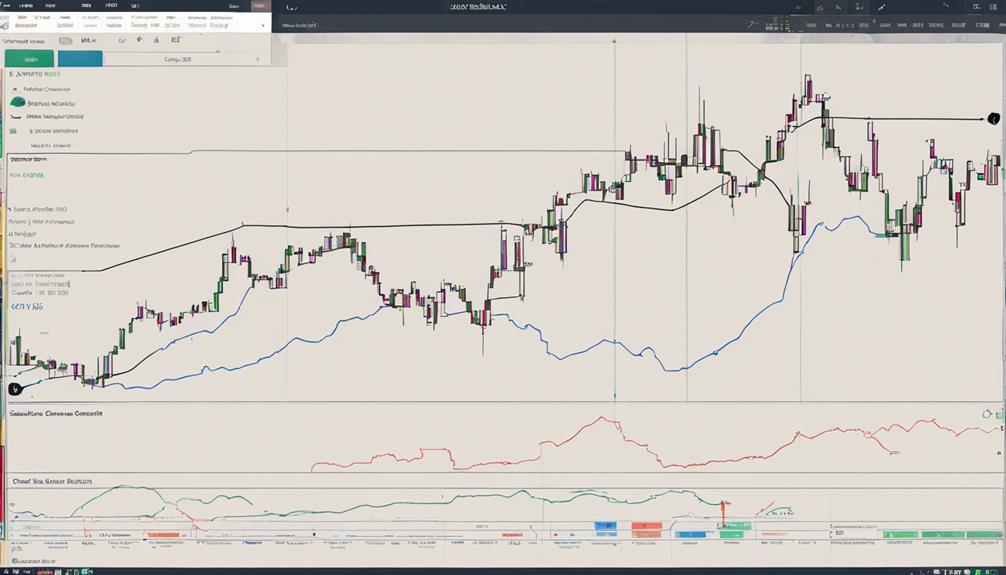
The key components of the Ichimoku Cloud indicator intricately interact to provide traders with valuable insights into market trends and potential trading opportunities.
The Conversion Line, calculated from the midpoint of the last 9 candlesticks, and the Base Line, derived from the midpoint of the last 26 candlesticks, form the foundation of the Ichimoku Cloud.
Leading Span A, positioned between the Conversion Line and Base Line, along with Leading Span B, representing the midpoint of the last 52 price bars, give a broader perspective on trend direction.
Additionally, the Lagging Span, trailing the price by 26 periods, aids in identifying support and resistance levels.
Together, these components generate trade signals by analyzing the relationship between them and the price action, offering a comprehensive view of the market dynamics.
Understanding Ichimoku Cloud Formulas
In comprehending the Ichimoku Cloud Formulas, one delves into the intricate calculations that underpin this powerful technical indicator.
- The Conversion Line is calculated by averaging the highest high and the lowest low over the last nine periods.
- The Base Line is determined by averaging the highest high and the lowest low over the past 26 periods.
- Leading Span A is the midpoint of the Conversion Line and the Base Line plotted 26 periods ahead.
- Leading Span B is the average of the highest high and the lowest low over the previous 52 periods, also projected 26 periods into the future.
Understanding these formulas is essential for interpreting trend direction, momentum, and forecasting accurately using the Ichimoku Cloud indicator.
Interpreting Ichimoku Cloud Signals
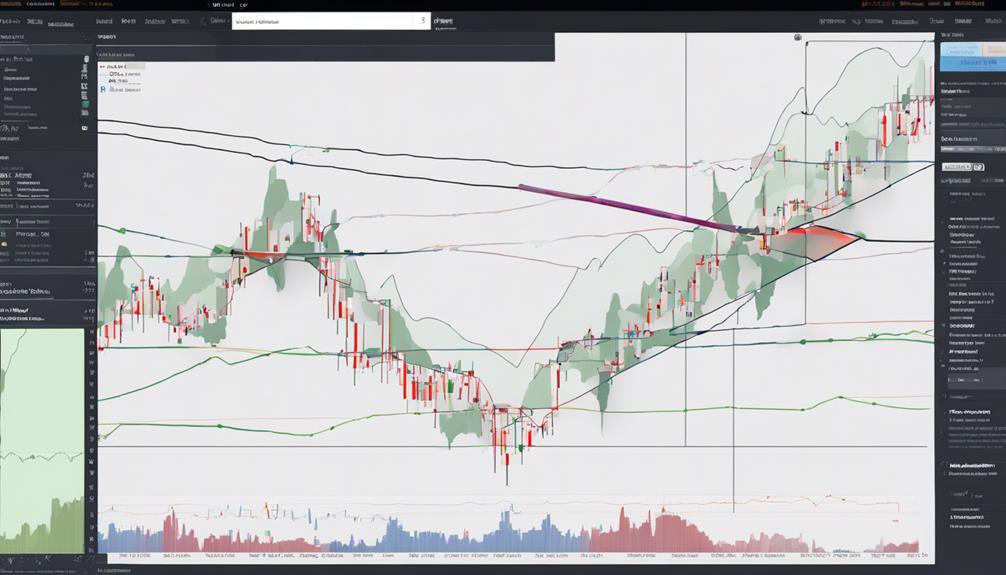
To properly interpret Ichimoku Cloud signals, focus on identifying key price relationships and momentum shifts. When the price is above the Cloud, it signals bullish momentum, while being below indicates bearish momentum.
The crossing of the Conversion and Base lines can confirm the direction of momentum in trading signals. During strong trends, the Ichimoku Cloud acts as dynamic support and resistance levels.
Observing price movement within the Cloud can provide insights into trend strength and momentum direction. Combining the Ichimoku Cloud with other indicators like the Relative Strength Index (RSI) can enhance the accuracy of trade signals, offering a comprehensive view for making informed trading decisions.
Practical Application of Ichimoku Cloud
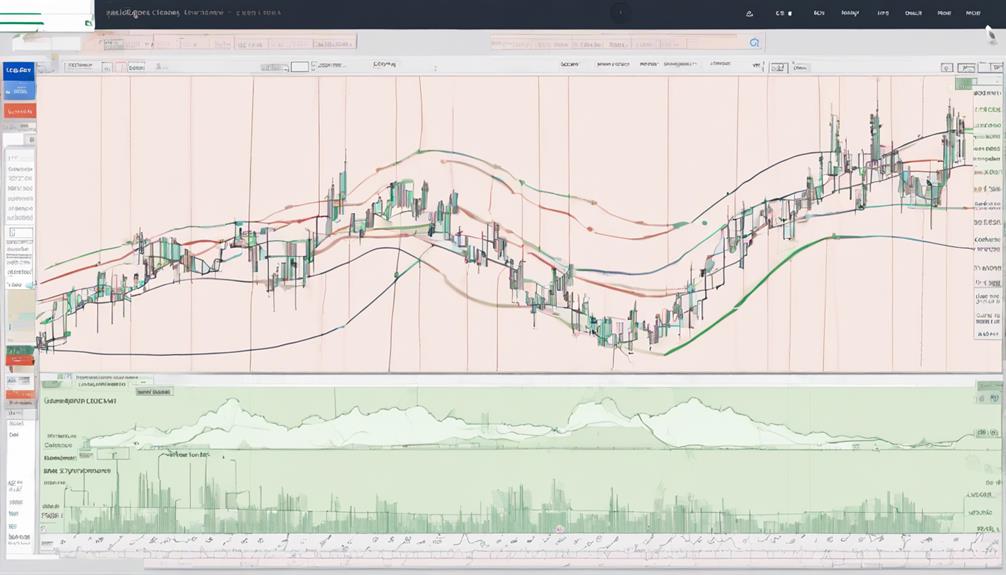
By applying the principles of the Ichimoku Cloud indicator, you can effectively assess market momentum and trend direction to make informed trading decisions. The indicator's components provide valuable insights into potential support and resistance levels, aiding in the identification of favorable trade opportunities across various markets like stocks, forex, and more.
Here are four practical applications of the Ichimoku Cloud:
- Utilize the Cloud formed by Leading Span A and B to identify future support and resistance levels.
- Gauge market momentum by observing the relationship between the Conversion Line and the Base Line.
- Generate trade signals based on the interactions between the different components of the Ichimoku Cloud.
- Identify prevailing trends by analyzing the positioning of the Cloud in relation to price action.
Tips for Effective Ichimoku Cloud Trading
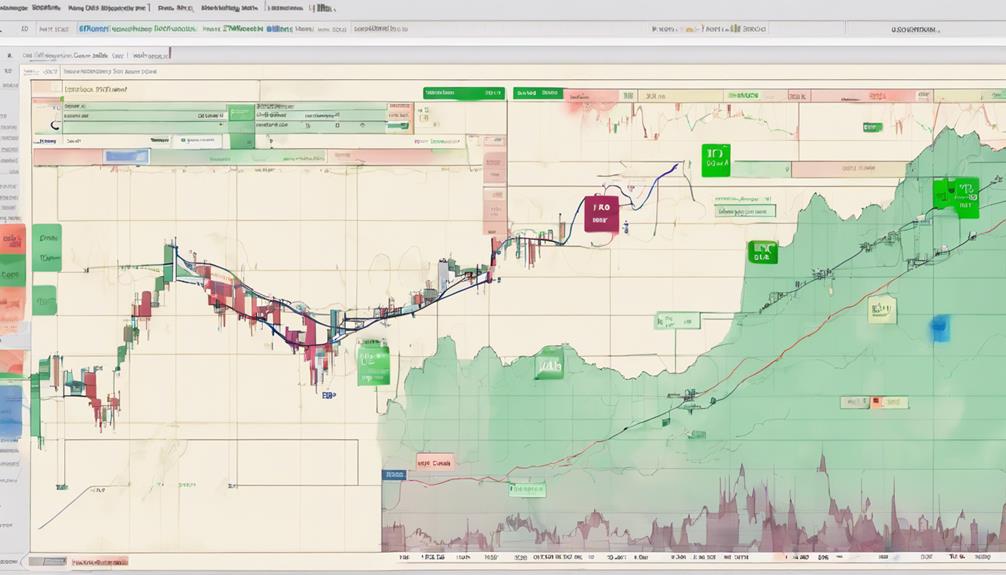
Utilizing the Ichimoku Cloud indicator effectively in trading requires a thorough understanding of its components and their interactions to make informed decisions. The indicator offers valuable insights into support and resistance levels, trend direction, and momentum. By analyzing all five components of the Ichimoku Cloud, traders can develop a robust trading strategy that incorporates technical analysis and candlestick charts.
It's crucial to use the Cloud to identify potential entry and exit points, as well as to forecast future support or resistance levels for effective trade planning. To enhance risk-adjusted returns, traders should validate Ichimoku Cloud signals with other technical analysis tools. By incorporating these tips into your trading approach, you can optimize your use of the Ichimoku Cloud and improve your overall trading performance.
What Are the Best Strategies for Understanding and Using the Ichimoku Cloud Indicator Effectively?
To master Ichimoku cloud analysis, it’s crucial to understand its five components: tenkan-sen, kijun-sen, senkou span A and B, and chikou span. Utilize it effectively by identifying trend direction, support and resistance levels, and potential future price movement. Combine it with other technical indicators for a comprehensive analysis.
Frequently Asked Questions
How Do You Read Ichimoku Cloud Indicator?
To read the Ichimoku Cloud indicator, observe price in relation to the Cloud. When price is above, consider buy signals; below, look for sell signals. Assess Leading Span A and B for trend strength. Utilize for momentum, support/resistance, and trading signals.
What Is the Basic Ichimoku Strategy?
Understanding the basic Ichimoku strategy is like deciphering a roadmap for trading. By analyzing trend direction, support/resistance levels, and crossovers between lines, you can navigate market sentiment effectively, making informed decisions with this indicator.
What Are the 5 Lines of the Ichimoku Cloud?
To understand the Ichimoku Cloud, grasp its five lines: Conversion Line, Base Line, Leading Span A, Leading Span B, and Lagging Span. They blend historical price data to reveal trends, momentum, and support/resistance levels effectively.
What Is the Best Timeframe for Ichimoku?
For Ichimoku Cloud, the best timeframe varies based on your trading style. Consider daily for swing trading, 1-hour for intraday, and weekly for long-term trends. Experiment with different timeframes to align with your strategy.
Conclusion
In conclusion, mastering the Ichimoku Cloud Indicator is like unlocking a treasure chest filled with valuable insights for traders. Just as the clouds in the sky reveal hidden patterns and signals, the Ichimoku Cloud Indicator unveils crucial information about market trends, support and resistance levels, and momentum.
By delving into its components and applications, traders can navigate the complex world of trading with clarity and precision, paving the way for successful decision-making.