
In the realm of financial markets, the Rate of Change (ROC) indicator stands as a critical tool for traders seeking to navigate the complexities of price movements. Its ability to quantify the pace of price variations offers traders a unique perspective that goes beyond mere price action analysis.
The ROC indicator's significance extends far beyond its basic calculation, providing traders with valuable insights that can significantly impact their decision-making processes. Understanding why the rate of change indicator is essential requires a closer examination of its multifaceted role in the dynamic world of trading.
Significance of Rate of Change Indicator
The Rate of Change (ROC) indicator plays a pivotal role in the arsenal of tools available to traders, offering a clear and quantitative measure of the velocity at which a security's price is evolving. As a key technical analysis tool, ROC provides traders with valuable insights into the momentum and trend of a security's price movements. By calculating the percentage change in price over a specified period, the ROC indicator helps traders gauge the speed at which prices are shifting, indicating potential shifts in market sentiment.
Traders rely on the ROC indicator to identify momentum shifts and confirm trends in the market. Positive ROC values typically indicate bullish sentiment, suggesting an upward trend in prices, while negative ROC values signal bearish sentiment and a potential downtrend. Understanding the Rate of Change indicator is essential for traders to make informed decisions, as it aids in assessing market dynamics and identifying possible trading opportunities based on the speed of price changes.
Benefits of ROC Indicator
An essential tool for traders seeking to enhance market analysis and decision-making is the ROC indicator, renowned for its ability to pinpoint crucial market conditions and signal potential trend reversals. The benefits of using the Rate of Change Indicator in technical analysis are significant:
- Identification of Overbought and Oversold Conditions: ROC helps traders identify when an asset is overbought or oversold, indicating potential reversal points.
- Spotting Divergence Signals: By comparing price momentum with the price movement, ROC can signal potential trend changes before they occur.
- Generating Buying and Selling Signals: Traders use ROC to generate signals based on zero line crosses, providing clear indications for entering or exiting trades.
- Confirming Trend Direction: ROC assists in confirming the direction of the trend, helping traders make informed decisions about their positions.
- Versatility and Applicability: The ROC indicator is versatile and applicable to various asset classes, making it a valuable tool for traders across different markets.
ROC Indicator in Trading
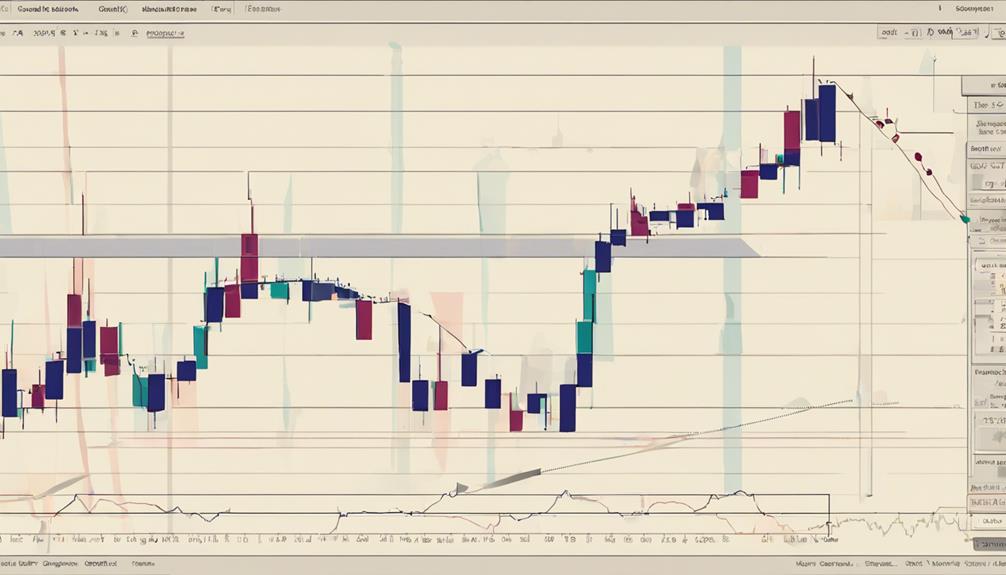
Building on the benefits highlighted in the previous discussion, the application of the ROC indicator in trading offers traders a strategic edge through its versatile functionality and precise analytical capabilities.
The Rate of Change (ROC) Indicator is commonly used by traders to identify overbought and oversold conditions in the market, providing valuable insights for potential trade setups. By acting as a momentum indicator, ROC helps traders spot divergences between price movements and momentum, signaling potential trend reversals.
Additionally, ROC crossovers can be leveraged as buy or sell signals, confirming changes in trend directions. Furthermore, the ROC indicator plays a crucial role in effective trade timing by capturing shifts in price momentum accurately.
Traders often integrate ROC into their trading strategies alongside other technical analysis tools to enhance trade confirmation and accuracy, making it a vital component in successful trading endeavors.
Importance of ROC Interpretation
By delving into the intricacies of Rate of Change (ROC) interpretation, traders can gain valuable insights into market conditions and potential trade opportunities. The Rate of Change indicator, often referred to as ROC, measures the percentage change in a security's price over a specified number of periods. When interpreting ROC, traders should consider the following key points:
- ROC is an unbounded momentum indicator that helps identify overbought or oversold conditions in the market.
- Positive ROC values typically indicate a bullish sentiment, suggesting upward price momentum.
- Negative ROC values, on the other hand, signal a bearish outlook, indicating downward price momentum.
- ROC calculations provide traders with a quantitative measure of the speed at which price changes occur in a security.
- Traders frequently use ROC as a tool to gauge the strength and direction of price momentum, aiding in decision-making processes related to trading strategies and risk management.
Enhancing Analysis With ROC
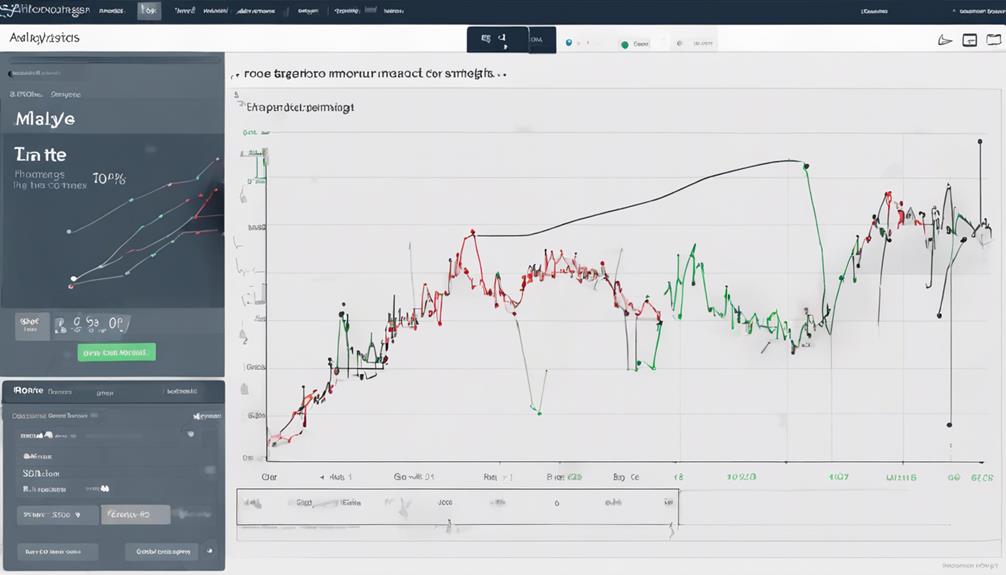
Utilizing the Rate of Change (ROC) indicator in market analysis enhances traders' ability to discern price momentum dynamics and make informed trading decisions. The ROC, a momentum indicator, calculates the percentage change in a security's price over a specific period, aiding in trend analysis.
Positive ROC values confirm uptrends, while negative values indicate downtrends, providing valuable insights for traders. Additionally, ROC is instrumental in identifying overbought or oversold conditions in the market, guiding traders on potential entry or exit points.
How Can the Rate of Change Indicator Benefit Me?
The rate of change indicator offers a comprehensive guide to interpreting the momentum of a stock’s price movement. By analyzing the rate at which the price is changing, this tool can help you identify potential trend reversals and make more informed trading decisions.
Frequently Asked Questions
What Is the Purpose of the Rate of Change Indicator?
The Rate of Change (ROC) indicator serves to measure the speed of price changes in a security by comparing current and past prices. It aids in identifying overbought or oversold conditions, offering insights into market sentiment and potential trend reversals.
What Does the ROC Indicator Tell You?
The ROC indicator informs traders about the speed of price changes in a security. It highlights potential overbought or oversold conditions, reveals bullish or bearish momentum, and aids in spotting divergences, crossovers, and trend shifts for strategic trading decisions.
How Can We Use Indicators to Measure Rate of Change?
To measure the rate of change, indicators such as the Rate of Change (ROC) can be employed. By comparing current prices to past prices over specific periods, ROC quantifies price movement as a percentage, aiding in trend identification and market sentiment analysis.
Why Are Indicators Important in Trading?
Indicators are crucial in trading as they provide objective data for analyzing price movements, identifying trends, and making informed decisions. They enhance technical analysis skills, help gauge market sentiment, and improve trading strategies.
Conclusion
In conclusion, the Rate of Change indicator is a crucial tool in trading, providing valuable insights into price momentum and potential trend reversals. Its significance lies in confirming trends, generating trading signals, and aiding in decision-making for traders across various asset classes and timeframes.
By enhancing analysis with the ROC indicator, traders can make informed decisions and improve their trading strategies.
How can traders leverage the power of ROC to optimize their trading performance?