
When it comes to navigating the complexities of the market, understanding why volume-based indicators are crucial can be a game-changer for your trading strategy.
By incorporating these indicators, you unlock a wealth of insights that can help you stay ahead of market movements and make informed decisions.
But what exactly makes volume-based indicators so essential?
Stay tuned to uncover the intricate details of how volume data can provide you with a competitive edge in the ever-evolving world of trading.
Understanding the Importance of Volume
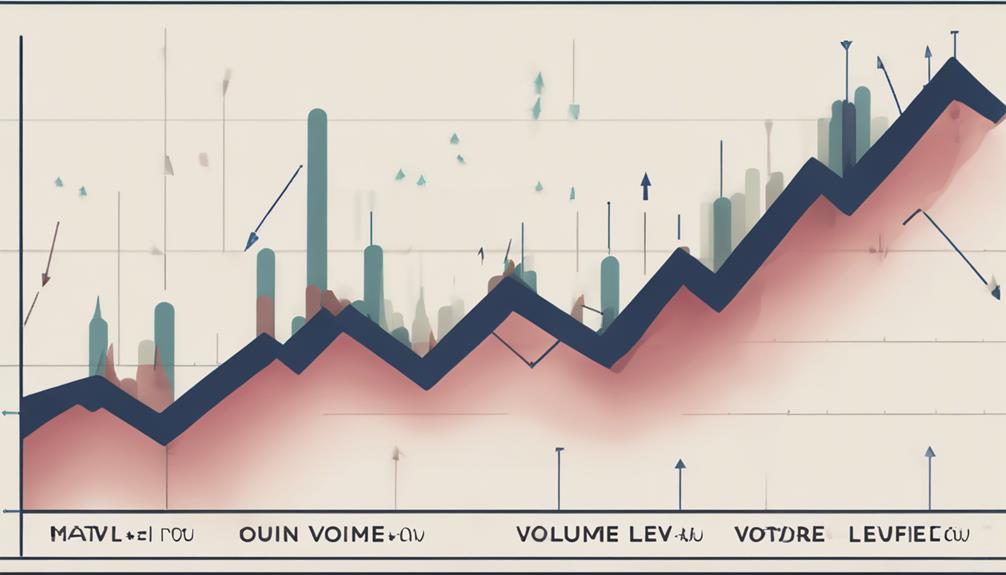
Understanding the significance of volume in trading is paramount for assessing market dynamics and making informed investment decisions. Volume serves as a barometer of trading activity, offering insights into investor sentiment and market trends. High volume typically accompanies strong price movements, affirming the validity of a trend.
Conversely, low volume may indicate a lack of conviction in the market, leading to choppy price action. Analyzing price alongside volume can help confirm trends, with volume spikes often signaling potential reversals or shifts in market sentiment.
Analyzing Volume Spikes
When analyzing volume spikes in trading, it's crucial to consider their context to avoid misinterpreting signals. Volume spikes often indicate increased market interest and can precede significant price movements, providing valuable insight for traders.
By applying volume data, one can identify the relationship between price moves and volume spikes, which can help in confirming the strength of a breakout or potential trend reversal. Low volume periods contrasted with sudden spikes can offer clues about market sentiment and potential shifts in direction.
Understanding the dynamics between volume spikes and price action is essential for making informed trading decisions, as these spikes can serve as confirmation signals for entering or exiting positions.
Utilizing VolumeAvg Indicator
Utilize the VolumeAvg indicator to effectively gauge market trends and potential reversals by calculating the average volume over a specified period. This volume-based indicator is crucial for day traders as it smooths out fluctuations in trading volume, making it easier to identify significant changes.
By comparing current volume levels to the average daily volume, traders can confirm price movements and assess the strength of a trend. The VolumeAvg indicator is a valuable technical tool that can assist traders in making informed decisions by providing insights into market dynamics.
It can be customized to different timeframes, allowing for flexibility in adapting to various trading strategies and preferences. Incorporating this indicator into your technical analysis can enhance your trading performance.
Interpreting Volume Trends
To gain valuable insights into market dynamics, consider interpreting volume trends as they play a crucial role in assessing the strength and potential reversals of price movements. Volume is the number of shares or contracts traded during a specific time frame.
Increasing volume during an uptrend can confirm bullish momentum, while a decrease in volume during a price rally might indicate weakening interest and a possible trend reversal. Traders and investors often use volume analysis to evaluate the strength or weakness of a price move by comparing current volume levels to historical data.
Sudden spikes in volume, especially near key support or resistance levels, can provide essential clues for potential price reversals or breakouts. Utilizing volume patterns alongside price patterns can enhance the effectiveness of technical analysis in making informed trading decisions.
Implementing Volume-Based Strategies

Curious about how volume-based strategies can enhance your trading decisions and confirm price movements? Implement volume-based strategies by analyzing spikes in volume during breakouts to validate the strength of price movements.
Keep an eye out for decreasing volume in line with a trend as it could indicate potential weakness and upcoming trend reversals.
Utilize volume not only to validate price action but also to predict potential price shifts. Enhance your trading decisions by combining volume analysis with other indicators such as simple moving averages or RSI.
How Do Volume-Based Indicators Enhance Trading Strategies?
Volume-based indicators offer three key benefits volumebased Indicators to enhance trading strategies. Firstly, they provide insights into market trends by analyzing the volume of trading activity. This helps traders make informed decisions based on the strength of buying or selling pressure. Secondly, these indicators can assist in identifying potential turning points in the market, allowing traders to enter or exit positions at optimal times. Lastly, volume-based indicators can confirm the validity of price movements, reducing the risk of false breakouts or reversals.
Frequently Asked Questions
Why Is the Volume Indicator Important?
Volume indicators are crucial as they reveal market interest and participation. High volume confirms price strength, hinting at trend continuation. Conversely, low volume suggests potential reversals. Analyzing volume helps validate trends and anticipate market shifts.
What Does the Volume Indicator Tell You?
The volume indicator tells you about the level of trading activity for an asset. High volume can show strong interest, while low volume might suggest market indecision. Analyzing volume helps you understand trends and potential price reversals.
Why Is Volume Important in Technical Analysis?
Volume is crucial in technical analysis as it confirms price movements. High volume indicates strong interest and can foreshadow price changes. Low volume signals trend uncertainty. Traders rely on volume to gauge trend strength. Patterns offer trading insights.
What Is the Use of Volume Profile Indicator?
The Volume Profile indicator displays trading volume at different price levels, helping you identify key areas of market activity. It reveals support and resistance levels based on historical data, offering insights into price behavior and aiding informed trading decisions.
Conclusion
In conclusion, volume-based indicators are crucial in trading for their ability to provide insight into market dynamics.
Did you know that over 70% of professional traders incorporate volume analysis into their strategies?
By understanding volume spikes, trends, and using volume-based indicators, you can make more informed trading decisions.
Remember to combine volume analysis with other indicators for a comprehensive approach to trading.