
The simple guide to the Zig Zag indicator offers traders a valuable tool for navigating the complexities of market trends and price movements. As a fundamental aspect of technical analysis, understanding how to interpret and utilize this indicator can significantly enhance one's ability to make informed trading decisions.
By grasping the basics of the Zig Zag indicator formula and exploring its practical applications, traders can unlock a world of potential insights into market behavior. This guide delves into the nuances of the indicator, offering insights into its advantages and disadvantages, as well as tips for maximizing its effectiveness in chart analysis.
Understanding Zig Zag Indicator Basics
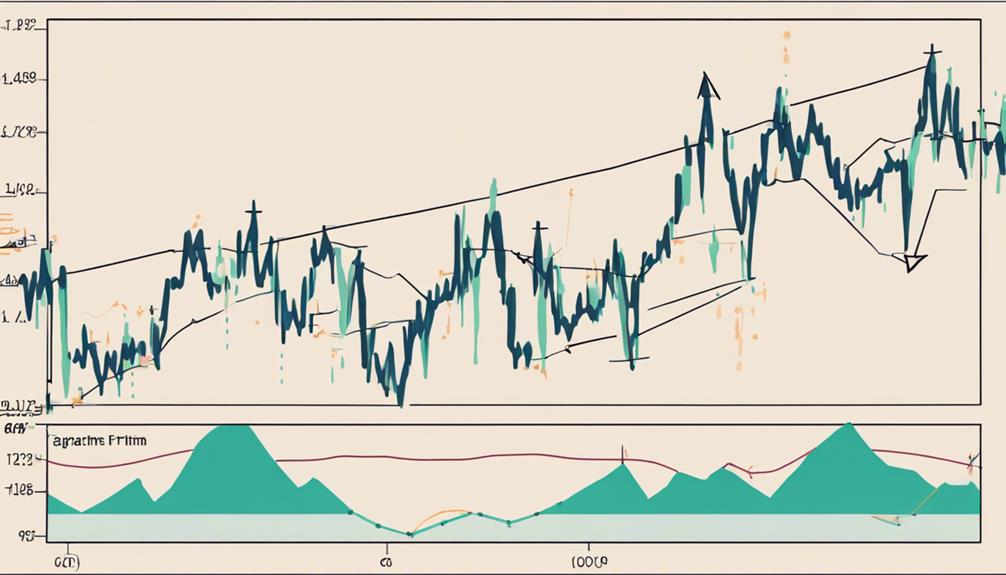
In grasping the fundamentals of the Zig Zag indicator, traders delve into a sophisticated tool designed to discern significant price movements amidst market noise. This technical analysis tool filters out random price fluctuations, focusing on identifying swing highs and lows to pinpoint potential trend reversals.
By plotting points on a price chart, the Zig Zag indicator helps traders visualize support and resistance levels, which are crucial for anticipating trend changes. Moreover, the indicator is commonly utilized alongside Elliott Wave Theory to enhance the accuracy of technical analysis.
Adjusting the percentage settings of the Zig Zag indicator allows traders to customize the tool for different securities, optimizing its performance for specific market conditions. Understanding the basics of the Zig Zag indicator is foundational for traders seeking to interpret price action effectively and make informed decisions based on the insights provided by this powerful analytical tool.
The Zig Zag Indicator Formula Explained
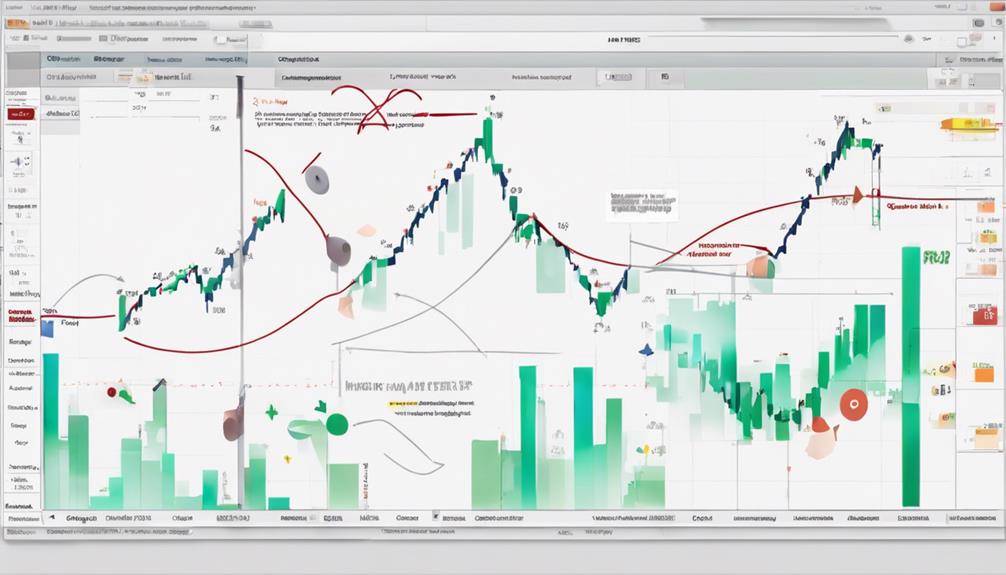
Exploring the mechanics of the Zig Zag indicator entails a detailed breakdown of its formula for plotting points based on high-low price series. The Zig Zag indicator formula incorporates a specified % change, allowing traders to identify significant price movements known as swing highs and swing lows.
Within the formula, traders have the option to choose between retracement or absolute change, depending on their analytical preferences. Additionally, the LastExtreme parameter plays a crucial role in determining whether the first or last observation should be considered for plotting points on the chart.
Advantages and Disadvantages of Zig Zag Indicator
When evaluating the Zig Zag indicator, it is essential to consider both its advantages and disadvantages in order to make well-informed trading decisions based on its signals.
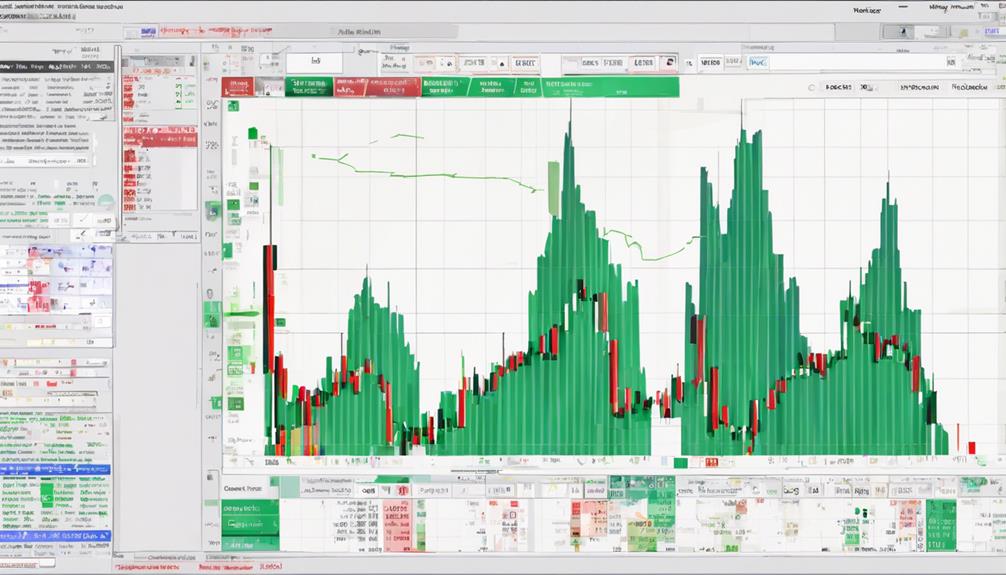
The Zig Zag indicator is beneficial for reducing noise in price data, making it easier to identify underlying trends. It can effectively highlight support and resistance levels, aiding traders in determining potential entry and exit points.
However, one of its drawbacks is that it may lag, potentially affecting the timing of trades. This lagging nature means that the most recent Zig Zag line can change, impacting the accuracy of buy and sell signals. Therefore, it is crucial to use the Zig Zag indicator to confirm trend direction rather than relying solely on it for trading decisions.
While it is a valuable tool for trend analysis, traders should exercise caution and consider other factors when executing trades to ensure a comprehensive assessment of market conditions.
Practical Application of Zig Zag Indicator
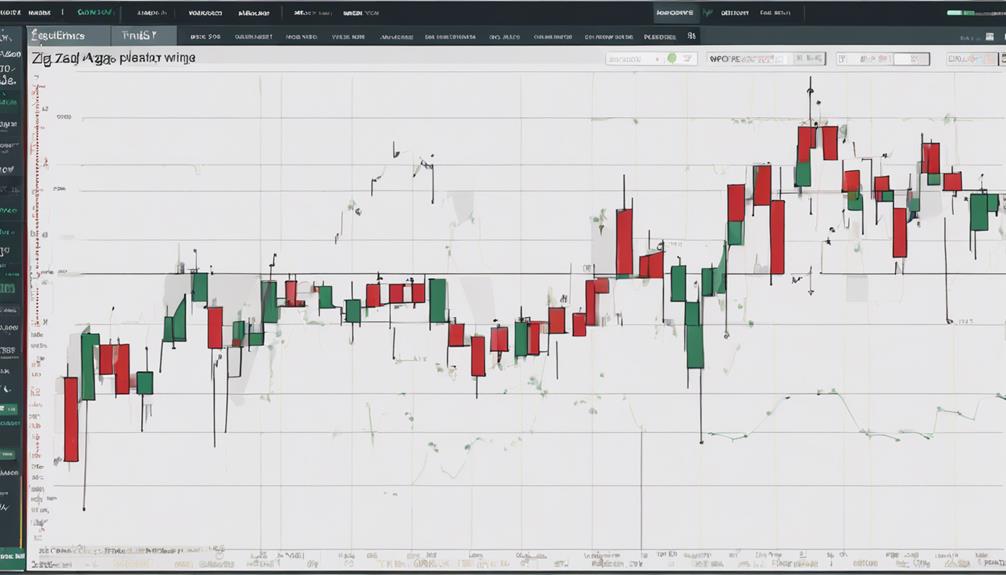
Considering the practical application of the Zig Zag indicator involves utilizing its noise-filtering capabilities to identify trends and patterns within price movements, aiding traders in making informed decisions based on potential support and resistance zones.
- The Zig Zag indicator filters out noise in price movements, revealing underlying trends.
- It helps traders identify potential support and resistance zones by plotting points on a price chart.
- Commonly used in conjunction with Elliott Wave Theory for trend analysis.
- Traders adjust the percentage setting of the Zig Zag indicator to optimize its performance for different stocks.
- Simplifies the process of recognizing trend reversals and can be a valuable tool in technical analysis.
Tips for Effective Zig Zag Indicator Usage
To enhance the effectiveness of utilizing the Zig Zag indicator, traders should carefully calibrate its settings to suit the specific characteristics of the securities being analyzed. Adjusting the parameters of the Zig Zag indicator is crucial to optimizing its performance across different securities.
It is advisable to experiment with various percentage settings, such as 5% to 10%, to align the indicator with different trading styles and market conditions. While the Zig Zag indicator can provide valuable insights into potential trend changes and reversal patterns, it is essential to use it in conjunction with other technical analysis tools for confirmation.
Traders should remember that the Zig Zag indicator is retrospective and not predictive, emphasizing the importance of using it as a tool to identify past trends and patterns rather than as a standalone forecasting instrument. By understanding the nuances of adjusting the Zig Zag indicator settings and integrating it effectively with other analytical tools, traders can leverage its capabilities to make informed trading decisions.
Can Beginners Use the Zig Zag Indicator with the Simple Guide?
The simplified zig zag indicator explained makes it easy for beginners to understand and utilize this technical analysis tool. With a simple guide, newcomers can learn how to interpret the zig zag pattern and use it to identify potential trend reversals in the market.
Frequently Asked Questions
What Is the Formula for Zigzag Indicator?
The formula for the Zig Zag Indicator involves the calculation of swing highs and lows in a price series by connecting points with trendlines. Parameters like high-low price series, percentage price movement, retracement, and observation selection influence its accuracy.
What Is the Best Zigzag Indicator Setting?
Optimizing the Zig Zag indicator setting is crucial for traders. Typically ranging between 5% and 10%, a 5% setting serves as a common choice for detecting price shifts effectively. This adjustment aligns with risk tolerance and trading preferences.
How Do You Use Zigzag Indicator Tradingview?
To utilize the Zig Zag indicator on Tradingview effectively, set the desired percentage parameters to identify trend reversals and price movements. Confirm support and resistance levels for securities on charts. Combine the Zig Zag indicator with other technical tools for comprehensive market analysis.
How Do You Use a Zigzag Indicator in Binary Trading?
Utilize the zigzag indicator in binary trading to identify trend reversals and significant price movements efficiently. By filtering out minor price swings, this tool highlights key fluctuations and reversal points, aiding traders in visual trend analysis. Adjusting the indicator's percentage setting can enhance effectiveness.
Conclusion
In conclusion, the Zig Zag indicator serves as a valuable tool for technical analysis, aiding traders in identifying trend reversals and significant price movements.
By filtering out short-term fluctuations and focusing on significant price changes, this indicator helps traders determine support and resistance areas.
Like a skilled navigator guiding a ship through turbulent waters, the Zig Zag indicator assists traders in navigating the complexities of the financial markets with precision and insight.