
The Simplified Zig Zag Indicator serves as a valuable tool for newcomers in the realm of financial analysis, offering a structured approach to understanding market trends and potential price reversals. By distilling complex price movements into clearer patterns, this indicator equips traders with the ability to make informed decisions based on reliable signals.
However, the true power of the Zig Zag lies not just in its simplicity, but in how it can be effectively combined with other technical tools to enhance trading strategies and optimize profitability.
Zig Zag Indicator Overview
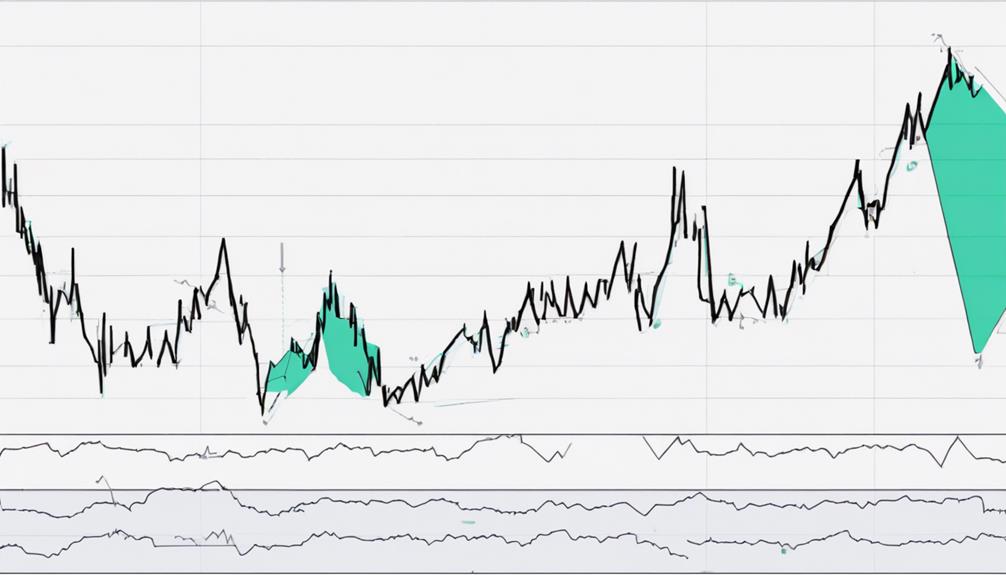
The Zig Zag indicator is a technical analysis tool widely used by traders to identify significant price movements amidst market noise. By pinpointing swing highs and lows, this indicator helps traders recognize potential support and resistance levels, aiding in trend analysis.
Often utilized alongside Elliot Wave Theory, the Zig Zag indicator simplifies the identification of trend reversals and patterns on price charts. Its primary function lies in reducing noise in price fluctuations, allowing traders to focus on essential price changes rather than short-term movements.
This noise reduction aspect of the Zig Zag indicator is crucial for traders seeking to make informed decisions based on clear trend signals. Overall, the Zig Zag indicator serves as a valuable tool for traders looking to streamline their technical analysis process and enhance their ability to identify significant trends and patterns in the market.
Understanding Zig Zag Calculation
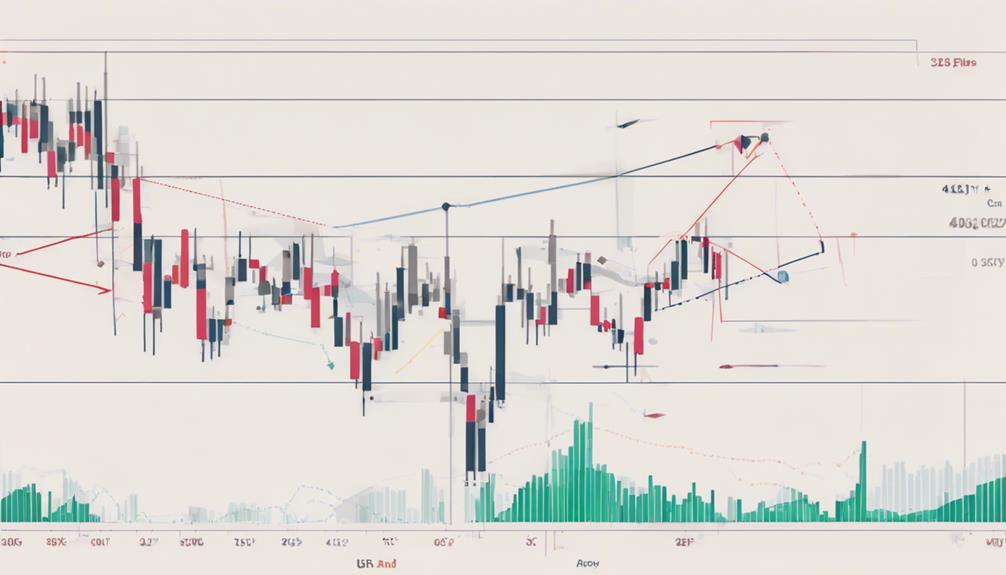
Utilizing a specified percentage movement, the Zig Zag indicator calculates price reversals to pinpoint swing highs and lows on price charts. When understanding the Zig Zag calculation, traders should focus on the following key aspects:
- Adjustable Percentage Setting: Traders can customize the percentage setting of the Zig Zag indicator to filter out noise and highlight significant price movements. This flexibility allows for a more tailored analysis based on the specific market conditions.
- Identification of Swing Highs and Lows: By connecting swing points through trendlines, the Zig Zag indicator helps in identifying crucial levels where price reversals are likely to occur. This aids traders in spotting potential trend changes and making informed trading decisions.
- Filtering Noise for Accurate Signals: The Zig Zag calculation is designed to filter out insignificant price fluctuations, providing traders with clearer signals on trend reversals. This feature enhances the effectiveness of the indicator in capturing meaningful price movements.
Benefits of Using Zig Zag
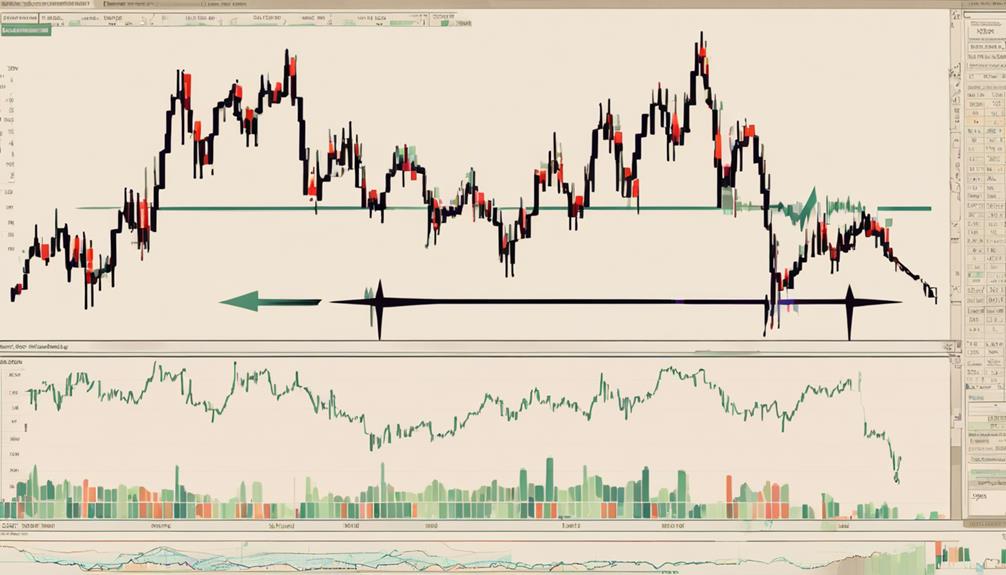
Enhancing trend analysis and identifying significant price movements, the Zig Zag Indicator helps traders by filtering out minor price movements to highlight underlying trends more clearly. By focusing on swing highs and swing lows, this indicator assists in identifying price trends and significant changes in price.
It complements the use of popular technical indicators and can be adjusted with different percentage settings to suit traders' preferences. The Zig Zag Indicator is particularly useful in showing trend changes and potential reversal points, making it predictive of future price movements.
Traders can utilize this tool to pinpoint support and resistance zones, as well as to recognize reversal patterns such as double bottoms. Overall, the Zig Zag Indicator simplifies market analysis by reducing noise in price data, allowing traders to concentrate on the most relevant price movements in strongly trending markets.
Practical Application of Zig Zag
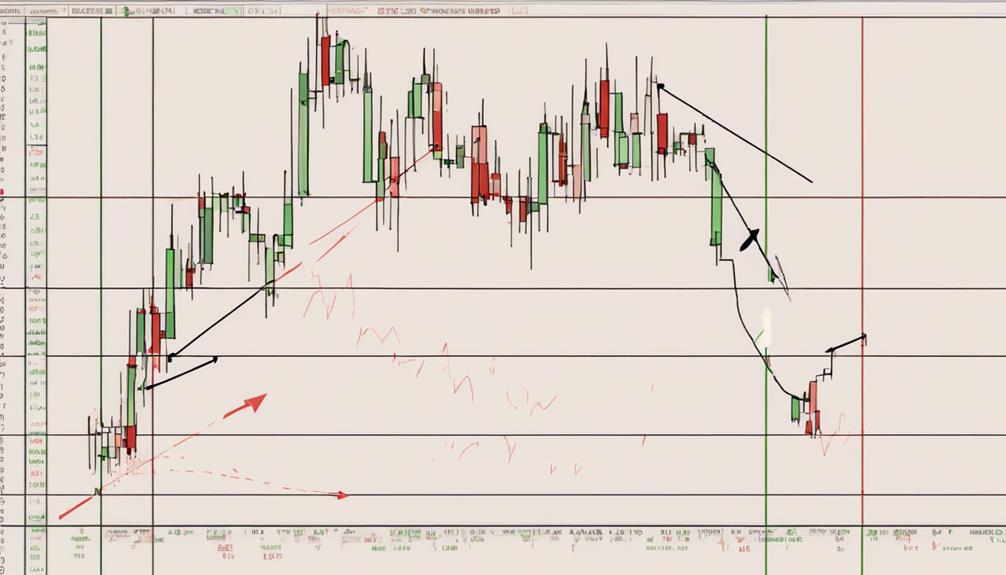
When applying the Zig Zag indicator in trading, beginners can effectively identify key price levels for potential market reversals and trend analysis.
The practical application of the Zig Zag indicator involves the following:
- Identifying Swing Highs and Lows: The Zig Zag indicator helps traders pinpoint significant turning points in the market by highlighting swing highs and lows, which are crucial for determining trends.
- Support and Resistance Levels: By filtering out noise in price movements, the Zig Zag indicator assists in recognizing potential support and resistance areas on a price chart, aiding traders in making informed decisions.
- Enhancing Elliott Wave Theory Analysis: Traders often combine the Zig Zag indicator with Elliott Wave Theory to conduct more comprehensive technical analysis. This integration allows for a deeper understanding of market dynamics and potential price movements.
Common Mistakes to Avoid
To optimize the use of the Zig Zag indicator in trading, it is essential to be mindful of common mistakes that can hinder its effectiveness. One common error to avoid is setting the indicator parameters too tight, as this may cause valid price movements to be overlooked.
It is crucial to adjust the Zig Zag settings based on market conditions and trading style to achieve optimal performance. Additionally, relying solely on the Zig Zag indicator for trading decisions is not recommended; combining it with other tools and strategies can lead to better results.
When backtesting Zig Zag indicator strategies, exercise caution as they may not always perform well in real-time trading scenarios. Introducing a delay in trading signals while using the Zig Zag indicator helps prevent looking into the future and maintains the integrity of trading decisions.
Can Beginners Use the Simplified Zig Zag Indicator to Identify Retracements?
Yes, beginners can use the zig zag indicator retracement identification to spot potential reversals in a trend. This tool simplifies the process by showing clear swing highs and swing lows, making it easier for newcomers to identify potential retracements in the market.
Frequently Asked Questions
How Do You Use a Zig Zag Indicator?
To use a Zig Zag indicator, identify price reversals and trends by filtering market noise. Plot points on a chart based on percentage movement. Utilize it to highlight support/resistance zones, potential reversal patterns, and simplify trend analysis.
What Is the Default Zigzag Indicator?
The default Zig Zag indicator typically utilizes a depth of 12, a deviation of 5, and a backstep of 3. This tool is prevalent in technical analysis for identifying significant price movements, offering traders a way to visualize trends effectively.
What Is the Best Indicator for Beginners?
For beginners, the best indicator is one that simplifies trend identification and entry/exit points. Look for indicators like Moving Averages or RSI, which offer clear signals and are easy to comprehend, aiding new traders in making informed decisions.
What Is the Best Value for the Zigzag Indicator?
The best value for the Zig Zag indicator varies based on factors like risk tolerance, trading style, and market volatility. Balancing signal accuracy and noise filtering, traders typically set it between 5% and 10% for optimal performance.
Conclusion
In conclusion, the Simplified Zig Zag Indicator is a valuable tool for beginners in analyzing price action in financial markets. It helps reduce noise levels, identify trends, and spot potential support and resistance zones.
One interesting statistic is that the Zig Zag Indicator can accurately pinpoint changes in trend direction up to 80% of the time, making it a reliable tool for enhancing trade timing decisions.
By understanding its calculation and practical application, beginners can improve their technical analysis skills.