
For trading novices, mastering moving averages, Bollinger Bands, and Stochastics is paramount. Understanding these technical indicators could be the key to unlocking profitable trading strategies.
By incorporating these tools, you can navigate the complex world of trading with more confidence and precision.
Basics of Trend Indicators
When delving into the basics of trend indicators, understanding the significance of moving averages is paramount for beginner traders. Moving averages, including EMAs and SMAs, are essential tools for analyzing price trends over specific periods.
The crossing of shorter-term and longer-term moving averages can indicate potential trend changes or reversals in the market. EMAs, with their responsiveness to recent price data, are particularly effective in identifying possible trend shifts.
Utilizing historical price data is crucial for pinpointing turning points in trends using moving averages. By paying attention to these indicators, you can better anticipate potential trend changes and make more informed trading decisions as you navigate the complexities of the market.
Understanding Mean Reversion Indicators
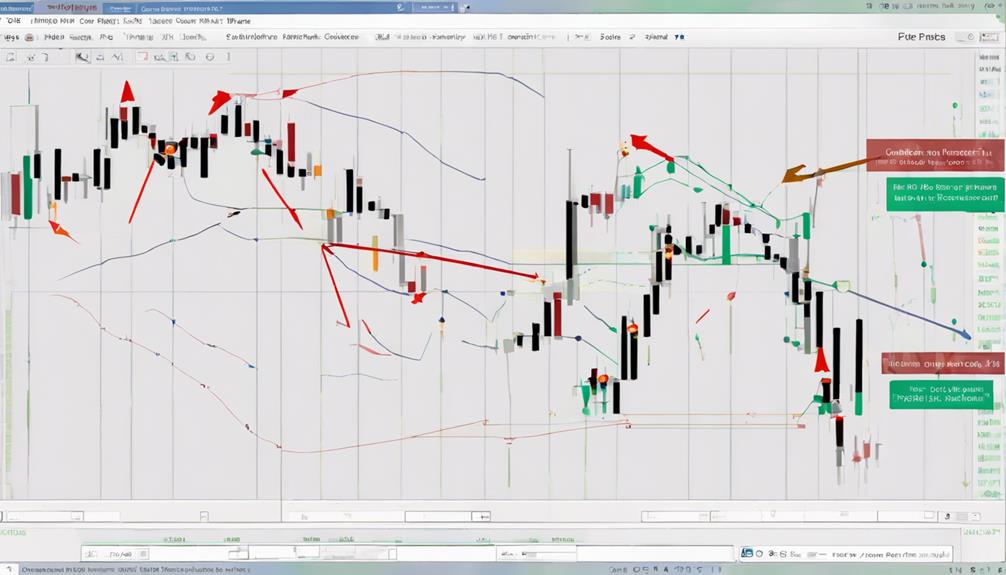
Moving on to the realm of mean reversion indicators, such as Bollinger Bands, offers traders a valuable perspective on price deviation and potential market reversals. Bollinger Bands, by measuring price deviation from a central pivot, assist in identifying potential turning points and hidden levels that trigger price retracements.
These bands expand and contract based on market volatility, providing insights into impulse moves back to the mean. Analyzing the distance of prices from the central pivot with Bollinger Bands aids in recognizing volatility and potential reversal points.
Utilizing mean reversion indicators like Bollinger Bands can enhance trend analysis, offering traders a tool to make informed decisions based on market dynamics and price movements.
Exploring Relative Strength Indicators
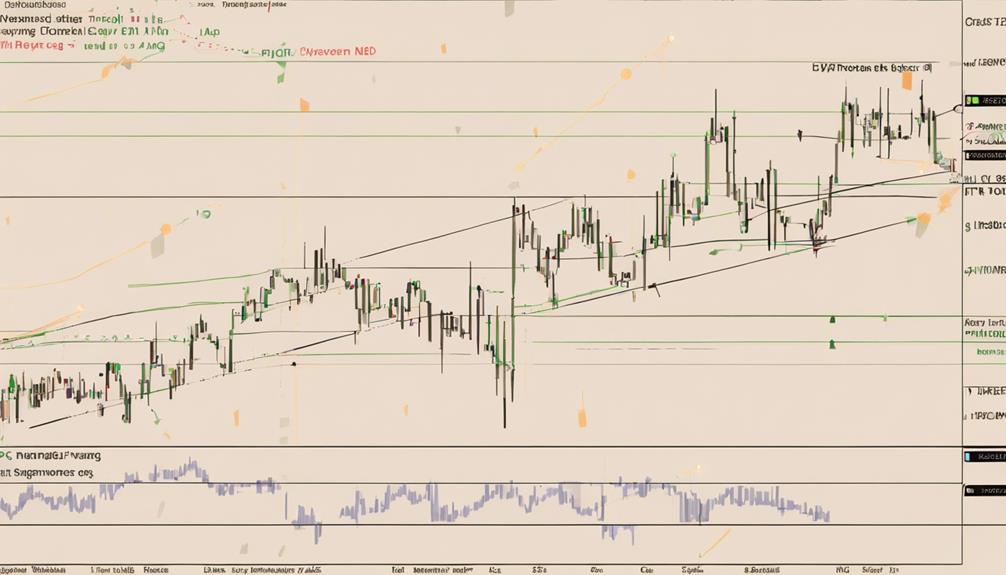
Exploring Relative Strength Indicators allows traders to gain valuable insights into market momentum and potential price reversals based on the Relative Strength Index (RSI).
The RSI, ranging from 0 to 100, helps identify overbought levels above 70 and oversold levels below 30. By using RSI, traders can confirm trends, detect divergences, and generate buy or sell signals based on price movements.
This indicator is versatile, adaptable to different markets, timeframes, and trading strategies, aiding beginners in understanding market sentiment and making informed trading decisions.
Recognizing overbought conditions may suggest a potential price decline, while oversold conditions could indicate a price increase. Utilizing RSI effectively can enhance your ability to interpret and act upon price movements accurately.
What are the Key Technical Indicators for Trading Beginners to Focus on?
When starting out in trading with technical indicators, beginners should focus on key indicators like moving averages, MACD, RSI, and Bollinger Bands. These indicators can help identify trends, momentum, and overbought/oversold conditions, providing valuable insights for making informed trading decisions.
Frequently Asked Questions
Which Indicator Is Best for Trading for Beginners?
For beginners, the best indicator for trading depends on your goals and risk tolerance. Evaluate your strategy, consider using multiple indicators like RSI, MACD, Bollinger Bands, Stochastic Oscillator, and Moving Average to make well-informed decisions.
What Are the Top 5 Technical Analysis Indicators?
When navigating the world of trading, the top 5 technical analysis indicators to consider are Moving Average, Relative Strength Index, Bollinger Bands, MACD, and Stochastic Oscillator. Each offers unique insights into market trends.
What Indicator Do Most Traders Use?
Most traders rely heavily on moving averages for trend analysis and reversals. The crossover of short and long-term moving averages often signals potential trend shifts. Incorporating moving averages into your strategy can help predict market trends effectively.
What Technical Indicator Is the Most Reliable?
The Relative Strength Index (RSI) stands out as one of the most reliable technical indicators. It helps you identify overbought and oversold market conditions, anticipate reversals, and gauge momentum. Combining RSI with other indicators enhances your trading decisions.
Conclusion
In conclusion, mastering moving averages, Bollinger Bands, and Stochastics is like having a compass, a radar, and a map in your trading journey. These essential technical indicators provide valuable insights into market trends, volatility, and potential reversals, guiding you towards making informed decisions and maximizing your trading success.
Just as a skilled navigator uses tools to navigate through rough waters, utilizing these indicators effectively can help you navigate the complexities of the financial markets with confidence.