
Understanding the intricate world of volatility indicators is paramount for investors navigating the dynamic landscape of financial markets. In a realm where precision and insight can make or break investment decisions, decoding these essential indicators serves as a cornerstone for informed choices.
As we explore the realm of volatility indicators, it becomes evident that each indicator offers a unique perspective on market behavior, risk assessment, and potential opportunities. Initiating a journey into deciphering these indicators promises a deeper understanding of market dynamics and the tools necessary to thrive in the realm of investments.
Importance of Volatility Indicators
Volatility indicators play a crucial role in the financial markets by aiding traders in assessing price uncertainty and risk levels. These indicators are essential tools that provide valuable insights into market conditions, enabling traders to make informed decisions. By analyzing volatility, traders can better understand the level of risk associated with a particular asset or market. This knowledge is particularly important for setting risk management strategies and determining appropriate stop-loss levels.
In times of high volatility, traders may experience increased price fluctuations, making it more challenging to predict market movements accurately. Volatility indicators help traders identify potential price breakouts, trends, and reversals, allowing them to adjust their trading strategies accordingly. For instance, indicators like Average True Range (ATR) and Bollinger Bands are commonly used to set stop-loss orders based on market volatility levels. By incorporating volatility indicators into their analysis, traders can optimize their trading strategies and effectively manage risks to achieve more consistent profits in fluctuating market conditions.
Cboe Volatility Index Explained
The Cboe Volatility Index (VIX) serves as a prominent metric for evaluating market risk and investor sentiment by leveraging options prices on the S&P 500 index to gauge expected volatility levels. Derived from the implied volatility of S&P 500 index options, the VIX reflects investors' consensus on future market volatility.
High VIX values are often interpreted as a sign of increased market uncertainty and the potential for significant price fluctuations. Traders and investors closely monitor the VIX as it can provide insights into market sentiment, potential trends, and reversals.
Due to its association with market fear and volatility levels, the VIX is commonly referred to as the 'fear gauge'. Understanding the VIX can help market participants make informed decisions, manage risk effectively, and navigate turbulent market conditions.
Average True Range (ATR) Breakdown
The breakdown of Average True Range (ATR) encompasses its calculation method and interpretation tips, providing investors with valuable insights into market volatility.
Understanding how ATR is computed allows traders to gauge the potential price range of a security accurately.
Moreover, interpreting ATR assists in making informed decisions regarding stop-loss orders and position sizing for more effective trading strategies.
ATR Calculation Method
In the realm of financial analysis, the calculation method for Average True Range (ATR) serves as a critical tool for assessing market volatility and making informed decisions in trading strategies.
- ATR calculates the average price range over a specified period, considering price gaps for a more accurate volatility measure.
- Calculation involves determining the highest value among current high minus current low, absolute value of current high minus previous close, or absolute value of current low minus previous close.
ATR aids in setting stop-loss orders by indicating potential price volatility and determining risk levels.
- Traders adjust position sizes based on ATR values to align with market volatility and manage risk effectively.
- It is a valuable tool for estimating price targets and determining optimal entry and exit points in trading strategies.
ATR Interpretation Tips
Analyzing market volatility through the Average True Range (ATR) breakdown offers traders valuable insights for effective risk management and strategic decision-making. ATR measures volatility by considering the price range and gaps over a specific period, aiding in setting appropriate stop-loss levels.
The true range, which determines ATR, is the maximum of the current high minus low, high minus previous close, or low minus previous close. By accounting for price gaps and fluctuations, ATR helps traders adjust position sizes according to market volatility levels.
Furthermore, ATR provides valuable information on potential price targets and assists in developing sound risk management strategies, making it a crucial tool for investors navigating fluctuating markets.
Understanding Bollinger Bands
Bollinger Bands are a technical analysis tool that consists of a simple moving average and two standard deviations, providing insights into price volatility. Understanding these bands involves grasping their basics, interpreting their signals, and analyzing their implications for trading strategies.
Bollinger Bands Basics
When assessing market volatility and potential price breakouts, understanding the basics of Bollinger Bands is essential for investors and traders. Bollinger Bands consist of a simple moving average and two standard deviations to depict price volatility. They widen or narrow based on market volatility, providing visual cues on potential breakouts. Bollinger Bands help identify overbought and oversold conditions in the market. Traders use Bollinger Bands on various timeframes like daily, weekly, and monthly for trend confirmation. When prices touch the bands for multiple periods, it can indicate a confirmed trend direction.
Bollinger Bands offer a dynamic way to visualize price movements.
They act as a reliable tool for identifying potential reversal points.
Traders can use Bollinger Bands to set stop-loss levels.
Bollinger Bands can help in determining the strength of a trend.
Understanding Bollinger Bands can enhance overall trading strategies.
Interpretation and Analysis
Understanding the nuances of interpreting and analyzing Bollinger Bands is crucial for investors and traders seeking to effectively gauge market volatility and make informed decisions. Bollinger Bands, consisting of a simple moving average line with upper and lower bands based on standard deviations, provide valuable insights into market conditions.
The widening of the bands during high volatility and their narrowing during low volatility periods offer visual cues about potential price movements. Moreover, these bands help identify overbought and oversold conditions in the market. When the price touches the upper band, it may indicate a potential selling opportunity, while touching the lower band may suggest a buying opportunity.
Traders can use these signals to develop strategies for entering or exiting positions based on the Bollinger Bands' analysis.
Trading Strategies With Bollinger
Utilizing technical analysis tools like Bollinger Bands can enhance traders' ability to formulate effective strategies based on market volatility indicators. Bollinger Bands consist of a simple moving average and two standard deviations to identify price volatility and potential breakouts. They help traders visualize price volatility by widening or narrowing based on market conditions. These bands are effective on various timeframes like daily, weekly, and monthly charts for trend confirmation. Bollinger Bands are useful in estimating counter-trend movements and overbought/oversold conditions in the market. When prices touch the bands for 2-3 periods, it confirms a trend direction and potential trading opportunities.
- Bollinger Bands aid in identifying market volatility.
- They provide visual cues for potential price breakouts.
- Bollinger Bands are versatile across different timeframes.
- Useful for spotting counter-trend movements.
- Confirm trend direction and trading opportunities when prices touch the bands.
Keltner Channel Indicator Overview
The Keltner Channel Indicator, a powerful tool in technical analysis, combines an exponential moving average with the average true range (ATR) to generate channel bands that aid traders in assessing market volatility and potential price movements.
By incorporating the ATR, this indicator effectively captures price volatility, offering insights into potential trend strength and reversals. The upper and lower bands of the Keltner Channel serve as dynamic levels indicating overbought and oversold conditions, guiding traders on possible entry and exit points.
Unlike static indicators, the Keltner Channel adapts to changing market conditions, providing traders with flexible support and resistance levels for making informed trading decisions. Traders leverage the Keltner Channel to gauge market volatility, identify trend changes, and establish risk management strategies.
Donchian Channel Indicator Details
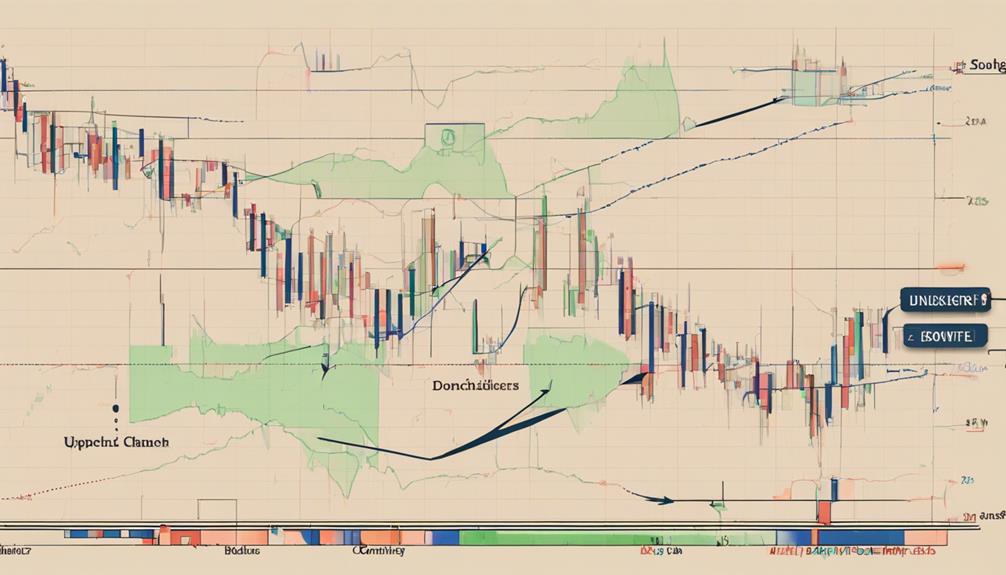
A key aspect of the Donchian Channel Indicator lies in its ability to track the highest high and lowest low prices within a specified timeframe, aiding traders in identifying potential breakout points based on historical price data. This indicator offers valuable insights for traders looking to make informed decisions based on market trends and price movements.
Here are some key details about the Donchian Channel Indicator:
- The indicator consists of three lines: the upper band representing the highest high, the lower band indicating the lowest low, and the middle band calculated as the average of the two.
- Traders utilize Donchian Channels to determine support and resistance levels, essential for establishing entry and exit points in trades.
- Donchian Channels are effective tools for capturing trends in the market, providing traders with a visual representation of price movements.
- By signaling potential price breakouts, the indicator assists traders in identifying opportunities for profitable trades.
- Incorporating the Donchian Channel Indicator into trading strategies can enhance decision-making processes and improve overall trading outcomes.
Chaikin Volatility Indicator Insights

Drawing on insights from the Donchian Channel Indicator's ability to capture market trends and price movements, the Chaikin Volatility Indicator offers further analytical depth by measuring price fluctuations and identifying potential reversals based on the intensity of these movements.
By analyzing the variance between high and low prices over a specified period, this indicator assists traders in recognizing trends and possible trend reversals. It quantifies volatility by comparing the trading range to the closing price, providing valuable insights into market dynamics.
High values on the Chaikin Volatility Indicator suggest heightened price movements, signaling potential trading opportunities. Traders can leverage this indicator to confirm the strength of trends, enabling them to make informed decisions and adjust their strategies accordingly.
Understanding the Chaikin Volatility Indicator's insights into price fluctuations and the intensity of market dynamics empowers investors to navigate the markets more effectively and capitalize on emerging trends.
Twiggs Volatility Indicator Unveiled
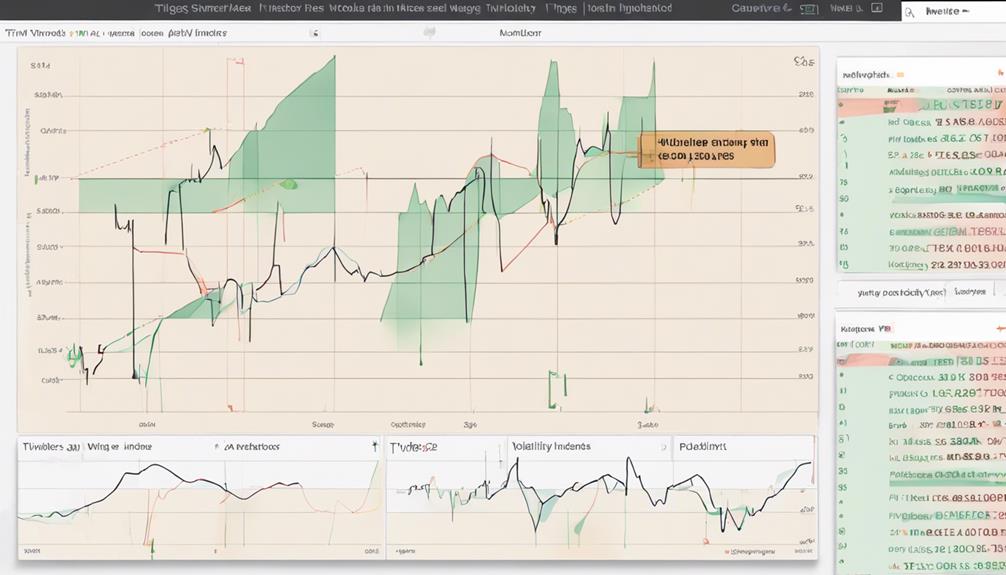
The Twiggs Volatility Indicator, with its unique formula, offers traders valuable insights into market volatility levels.
By understanding this indicator, investors can make informed decisions regarding risk management and trade execution.
Utilizing the Twiggs Volatility Formula and interpreting its signals can enhance traders' ability to navigate changing market conditions effectively.
Twiggs Volatility Formula
Colin Twiggs developed the Twiggs Volatility Indicator as a technical analysis tool to gauge market volatility by analyzing the high-low range and closing prices of a security. The formula for this indicator involves smoothing True Range values to provide a clearer understanding of volatility.
Here are some key points about the Twiggs Volatility Formula:
- Accurate Measurement: Provides a precise measure of market volatility.
- Trend Analysis: Useful for analyzing trends based on volatility levels.
- Informed Decisions: Helps traders make informed decisions during periods of high or low volatility.
- Risk Management: Aids in setting appropriate stop-loss orders based on volatility.
- Enhanced Trading Strategies: Enables traders to adjust strategies based on market volatility levels.
Interpretation Tips
Analyzing the Twiggs Volatility Indicator through interpretation tips offers traders valuable insights into market dynamics and potential trading opportunities. By understanding the Average True Range (ATR) calculation that underpins this indicator, traders can gauge price volatility more effectively.
The Twiggs Volatility Indicator smooths out price movements, providing a clearer view of volatility trends. This information can help traders identify potential breakouts or reversals in the market. Moreover, the indicator assists traders in setting appropriate stop-loss levels based on the volatility of the asset being traded.
Decoding Relative Volatility Index (RVI)
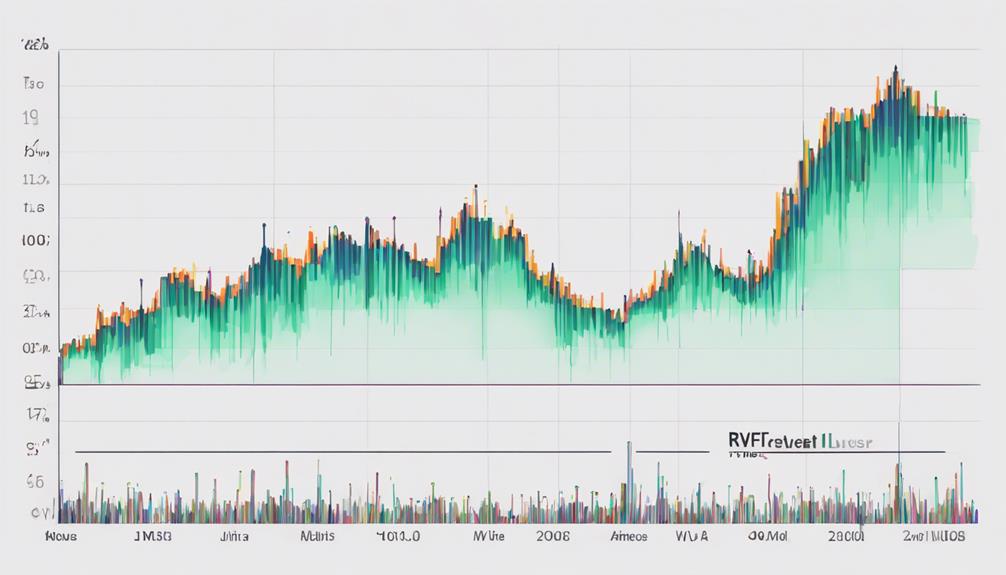
In the realm of financial analysis and market evaluation, understanding the Relative Volatility Index (RVI) holds significant importance. The RVI serves as a crucial tool for traders, providing insights into the volatility of an asset based on the comparison of upward and downward price movements.
Here are some key points to consider when decoding the Relative Volatility Index (RVI):
- RVI oscillates between 0 and 100, with values above 50 indicating increasing volatility and values below 50 suggesting decreasing volatility.
- Traders utilize RVI to confirm the strength of a trend and identify potential trend reversals in the market.
- RVI enables traders to make informed decisions about adjusting their positions or capitalizing on volatile market conditions.
- By incorporating RVI into their analysis, traders can gain a deeper understanding of the intensity of price movements and tailor their strategies accordingly.
- The Relative Volatility Index (RVI) plays a vital role in enhancing trading decisions and risk management strategies.
How Volatility Indicators Aid Investment
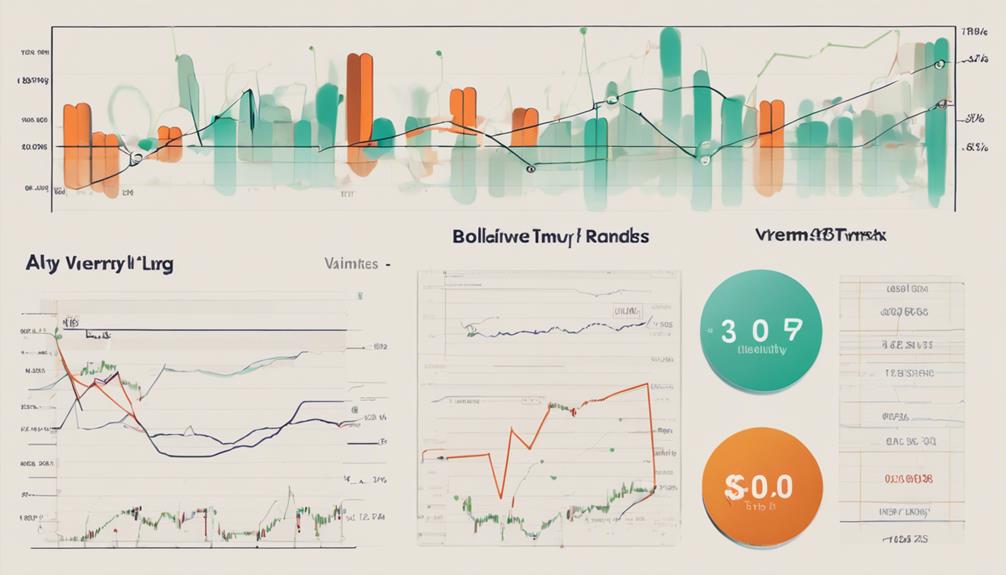
Volatility indicators play a crucial role in aiding investment decisions by providing valuable insights into market uncertainty and risk associated with price fluctuations. These technical analysis tools assist in risk management by helping investors anticipate potential price breakouts, reversals, and trends.
By utilizing indicators like Bollinger Bands and Average True Range (ATR), investors can effectively set stop-loss levels and optimize entry/exit points, thus enhancing their trading strategies. Understanding how these volatility indicators work is essential for managing risk, identifying market sentiment, and improving overall trading performance.
Combining different volatility indicators offers a comprehensive view of market conditions, enabling investors to make more informed decisions and potentially improve their investment outcomes. By incorporating volatility indicators into their analysis, investors can better navigate market volatility, make strategic investment choices, and ultimately increase the likelihood of achieving their financial goals.
Are the Volatility Indicators for Binary Options the Same as Those for General Investments?
When it comes to binary options, the best volatility indicators explained are not necessarily the same as those for general investments. While both types of investments rely on volatility indicators to make informed decisions, the specific indicators used may vary based on the nature of the investment.
Frequently Asked Questions
What Is the Volatility 10 Index Indicator?
The Volatility 10 Index is a measure of volatility for synthetic indices, known for its high volatility relative to other indices. Traders utilize it to speculate on short-term price movements, aiding in decision-making during volatile market conditions.
What Is the Best Indicator to Detect Volatility?
When detecting volatility in financial markets, the Bollinger Bands stand out as a key indicator. By analyzing price movements within these bands, investors can identify potential breakouts and make informed decisions based on market volatility.
How to Interpret Vix?
Interpreting the VIX involves analyzing the Cboe Volatility Index to gauge market expectations of future volatility. A higher VIX indicates increased expected market turbulence. Traders use the VIX as a 'fear gauge' to adjust strategies based on investor sentiment and uncertainty levels.
How Do You Analyse Volatility Indices?
Analyzing volatility indices involves studying market fluctuations using indicators like Bollinger Bands, Average True Range (ATR), and Keltner Channel. These tools gauge price movements, assess trends, and provide insights for setting stop-loss levels and adjusting position sizes based on market volatility.
Conclusion
In conclusion, the utilization of essential volatility indicators in investment analysis is crucial for identifying trends, measuring market sentiment, and making informed trading decisions. These indicators provide valuable insights into market volatility, risk management, and optimal entry/exit points for investments.
By incorporating these indicators into investment strategies, investors can enhance their trading performance and mitigate potential risks. As the famous saying goes, 'knowledge is power,' and in the world of investing, knowledge of volatility indicators is indeed power.