
Exploring the Top 10 Insights Into Trix Indicator Momentum Trading unravels a realm of strategic possibilities for traders seeking to elevate their market performance.
From deciphering the intricacies of the Trix Indicator to mastering the art of interpreting its signals, each insight offers a crucial piece of the puzzle in navigating the dynamic financial landscape.
By delving into the nuances of leveraging Trix for market analysis, optimizing its settings, and understanding divergence patterns, traders can unlock a treasure trove of potential opportunities.
Stay tuned to discover how Trix Indicator Momentum Trading can revolutionize your trading approach and open doors to enhanced profitability.
Understanding the Trix Indicator
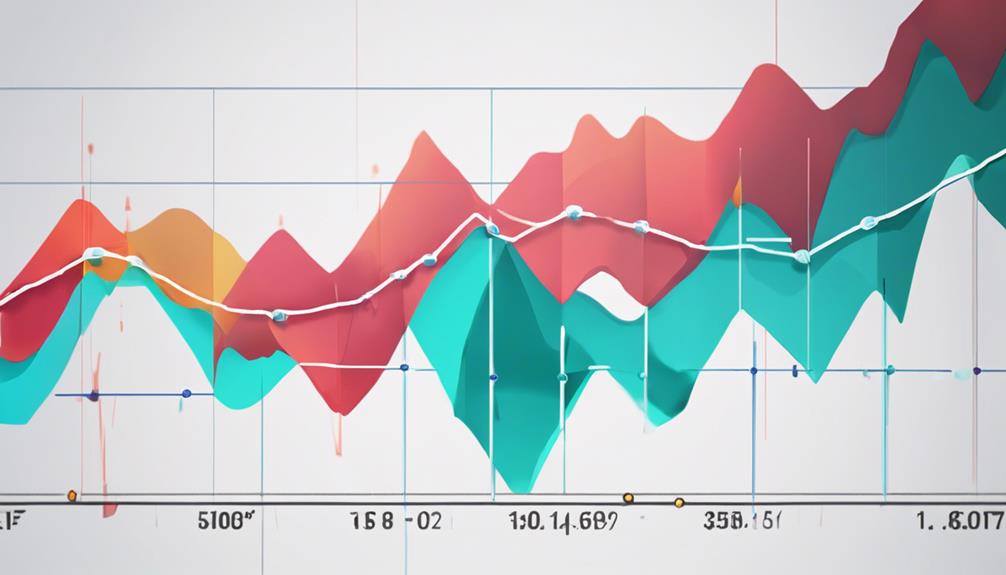
The Trix indicator, a pivotal tool in technical analysis, offers traders a comprehensive insight into market momentum and asset strength. Developed by Jack Hutson in the 1980s, TRIX is based on exponential moving averages (EMAs) and calculates a triple exponentially smoothed moving average.
By filtering out insignificant price movements, TRIX helps identify significant price movements in the market. One of the key features of TRIX is its ability to signal overbought or oversold conditions in the market. When TRIX values are high, it suggests an overbought market, indicating a potential reversal or correction in prices. Conversely, when TRIX values are low, it signifies an oversold market, suggesting a potential buying opportunity.
This aspect of TRIX enables traders to make informed decisions by generating buying or selling signals based on positive or negative TRIX values. Additionally, divergences in TRIX can provide valuable insights into potential market reversals, further aiding traders in their decision-making process.
Importance of Momentum Trading
Amidst the dynamic landscape of financial markets, understanding the significance of momentum trading emerges as a crucial element for traders navigating the realm of price movements and trends. Momentum trading focuses on capturing the rapid changes in asset prices, aiming to capitalize on the momentum generated by these movements. By utilizing momentum indicators such as TRIX, traders can assess the velocity of price changes, enabling them to make more informed trading decisions. These indicators provide valuable insights into the strength and direction of trends, helping traders identify potential entry and exit points in the market.
Trading strategies centered around momentum often involve buying assets that are exhibiting strength and selling those that are displaying weakness. By following these strategies, traders seek to ride the wave of momentum and generate profits from the prevailing trends. Understanding the importance of momentum trading can enhance a trader's ability to navigate the complexities of the financial markets and optimize their trading performance.
Interpreting Trix Indicator Signals
Understanding and analyzing signal crossovers, along with observing divergences and convergences, are crucial aspects of interpreting Trix indicator signals.
Signal crossovers above or below the zero line provide actionable insights for potential buy or sell opportunities in the market.
Additionally, spotting divergences between price movements and the Trix indicator can offer early indications of market reversals, aiding traders in making informed decisions.
Signal Crossovers Analysis
How do signal crossovers in the Trix indicator provide valuable insights for traders looking to interpret market momentum accurately?
Signal crossovers, such as when the TRIX line crosses above or below the zero line, are crucial in determining market entry and exit points.
When the TRIX line crosses above zero, it generates a buy signal, indicating a strengthening momentum.
Conversely, a TRIX line crossing below zero acts as a sell signal, signaling a potential decrease in momentum.
These crossovers serve as pivotal moments for traders to assess market conditions and make informed decisions.
Divergence and Convergence
Interpreting Trix indicator signals involves analyzing divergence and convergence patterns to ascertain potential market reversals and confirm existing trends with precision.
Divergence in TRIX signals occurs when the price trend and TRIX direction conflict, indicating a possible shift in market direction. Bullish divergence, characterized by lower price lows and higher TRIX lows, suggests a potential uptrend. Conversely, bearish divergence, where price highs increase while TRIX highs decrease, may indicate an upcoming downtrend.
On the other hand, convergence in TRIX signals aligns price trends with TRIX direction, reinforcing the current market trend. Recognizing these divergence and convergence signals in TRIX can be instrumental for traders in identifying critical market turning points efficiently.
Leveraging Trix for Market Analysis
When leveraging Trix for market analysis, one can gain valuable insights into the underlying momentum of a security or market.
The TRIX indicator, being a triple exponentially smoothed moving average (EMA), effectively filters out insignificant price movements, focusing on notable changes instead. This feature allows traders to identify overbought or oversold conditions in the market.
By interpreting the positive and negative values generated by TRIX, traders can receive signals for potential buying or selling opportunities. Moreover, divergences within the TRIX indicator can serve as early warnings for potential market reversals, providing traders with a chance to capitalize on such shifts in momentum.
Optimizing Trix Indicator Settings
Optimizing Trix indicator settings involves meticulously adjusting parameters to find the optimal configuration that suits the trading strategy.
By testing different setups, traders can determine the most effective TRIX period for their specific needs.
This analytical approach to finding the right settings can enhance the indicator's performance in capturing momentum and generating actionable trading signals.
Trix Indicator Parameters
Adjusting the parameters of the TRIX indicator can significantly impact its performance in aligning with specific trading strategies. When optimizing TRIX indicator settings, consider the following:
- The default parameter setting is often 14 periods.
- Longer timeframes decrease sensitivity to price movements.
- Shorter timeframes increase sensitivity, reacting more promptly to market changes.
TRIX works best when combined with other analysis methods.
Optimal settings depend on the trading strategy employed.
Finding Optimal Settings
To enhance the effectiveness of the TRIX indicator in aligning with specific trading strategies, fine-tuning the indicator parameters becomes crucial for optimizing trading performance.
Adjusting the TRIX indicator settings involves modifying the period lengths to cater to various trading styles and timeframes. While the default setting is commonly 14 periods, traders can experiment with shorter periods like 8 or 10 for increased sensitivity in signals suitable for quick trades. Conversely, longer periods such as 20 or 25 can offer smoother signals better suited for identifying longer-term trends.
Testing Different Configurations
Exploring various configurations of the TRIX indicator involves fine-tuning parameters such as period lengths to enhance trading signal optimization. Traders can experiment with different TRIX settings, like adjusting EMA periods, to identify the most effective configuration for their momentum trading strategies. Optimization of TRIX indicator settings plays a crucial role in improving accuracy in recognizing momentum shifts and overbought/oversold conditions. By carefully fine-tuning these parameters, traders can elevate the performance of the TRIX indicator in generating buy and sell signals. Understanding the impact of different configurations on TRIX signals empowers traders to make well-informed decisions when implementing their momentum trading strategies.
- Experiment with various TRIX settings, such as EMA periods.
- Optimize TRIX indicator settings to improve signal accuracy.
- Fine-tune parameters for enhanced buy and sell signals.
- Recognize momentum shifts and overbought/oversold conditions.
- Make informed decisions in momentum trading strategies.
Strategies for Trix Indicator Trading
Utilizing the TRIX indicator in trading involves strategically analyzing zero line crossovers to gauge momentum shifts and potential buying opportunities. Traders often look for significant turning points when the TRIX line crosses above or below the zero line.
A TRIX line moving above zero signals strengthening momentum and may present buying opportunities. Additionally, bearish and bullish divergences in the TRIX indicator can indicate possible market trend reversals. Divergences occur when the direction of the TRIX indicator contradicts the price action, suggesting potential shifts in market sentiment.
Traders can use these divergences as signals to anticipate changes in market direction. By incorporating these strategies into their trading approach, investors can enhance their ability to identify potential entry and exit points based on the TRIX indicator's insights into momentum shifts and trend reversals.
Trix Indicator Divergence Analysis
Analyzing Trix indicator divergences is essential for traders seeking to interpret market signals accurately. Understanding the significance of divergence signals, including bullish and bearish divergences, can provide valuable insights into potential market reversals.
Divergence Signals Significance
What significance do divergence signals hold in TRIX indicator analysis, and how do they impact market momentum and trend direction?
Divergence signals in TRIX indicator analysis play a crucial role in identifying potential shifts in market momentum and trend direction. Specifically, bullish divergence, where TRIX rises as prices fall, indicates a potential bullish reversal, while bearish divergence, where TRIX falls as prices rise, suggests a possible bearish reversal. Traders rely on these signals to anticipate significant turning points in market trends, enabling them to make informed trading decisions. Successfully understanding and leveraging TRIX indicator divergences can present profitable trading opportunities.
- Divergence signals indicate shifts in market momentum and trend direction.
- Bullish divergence suggests a potential bullish reversal.
- Bearish divergence indicates a possible bearish reversal.
- Traders use these signals to anticipate significant turning points.
- Capitalizing on TRIX indicator divergences can lead to profitable trading opportunities.
Interpreting Bullish Divergence
Interpreting Bullish Divergence in TRIX indicator analysis involves identifying instances where price establishes a lower low while TRIX forms a higher low, indicating potential signals for a bullish reversal in the market. This bullish divergence suggests that despite the downward price movement, momentum is shifting positively, potentially signaling a trend reversal towards an upward direction.
Traders often see bullish divergences as early indications of a change in market sentiment, hinting at increased buying pressure. To enhance the reliability of this signal, traders may seek confirmation from other technical indicators or observe corresponding price action movements.
Recognizing and understanding bullish divergences in TRIX analysis can assist traders in anticipating and positioning themselves for possible upward price movements, aiding in making informed trading decisions.
Spotting Bearish Divergence
In the context of TRIX indicator analysis, detecting bearish divergence signifies a scenario where the price records a higher high while TRIX registers a lower high, indicating potential momentum weakening and suggesting a potential reversal towards a downward trend.
- Bearish divergence in TRIX signals weakening upward momentum.
- Traders anticipate potential selling opportunities in the market.
- Monitoring TRIX divergence helps identify shifts in market sentiment.
- It provides timing cues for entering short positions.
- Combining bearish TRIX divergence with other indicators enhances signals for downward movement.
Trix Indicator for Entry and Exit
Utilizing the Trix indicator effectively for entry and exit points is a key aspect of momentum trading strategies. The TRIX indicator provides valuable insights into market momentum, helping traders identify optimal times to enter or exit trades. Positive TRIX values often indicate potential entry points, suggesting an increase in momentum that could lead to favorable price movements. Conversely, negative TRIX values may signal potential exit points, indicating a decrease in momentum and a possible reversal in price direction.
One of the critical ways traders use the TRIX indicator for entry and exit decisions is by observing TRIX crossovers with the zero line. When the TRIX line crosses above the zero line, it can signify a bullish entry opportunity. On the other hand, a TRIX crossover below the zero line may indicate a bearish signal for exiting a trade. By monitoring TRIX values alongside price action, traders can make more informed decisions and improve the timing of their trades, enhancing overall trading strategies and risk management practices.
Combining Trix With Other Indicators
When incorporating the Trix indicator with other technical tools, traders can enhance the accuracy of buy and sell signals for more robust market analysis. Combining TRIX with RSI can provide improved signals in range-bound markets, while pairing TRIX with MACD can offer valuable insights for identifying trend entry and exit points.
Additionally, integrating TRIX with other indicators like Bollinger Bands can lead to more diversified analysis, enhancing overall decision-making. By using TRIX in conjunction with ADX, traders can gain a better understanding of trend strength and momentum, which can be crucial for successful trading strategies.
Moreover, combining TRIX with moving averages can help validate trend direction and pinpoint potential entry and exit levels more effectively. Overall, leveraging the synergies between TRIX and other indicators can lead to more informed trading decisions and improved performance in the markets.
Real-world Applications of Trix Indicator
With its versatility across various markets, the Trix indicator serves as a powerful tool for traders seeking to pinpoint trend reversals and capitalize on momentum shifts. Traders can apply the TRIX indicator in stocks, forex, commodities, and cryptocurrencies to identify overbought/oversold conditions and potential entry or exit points.
By utilizing TRIX, traders can filter out market noise and focus on significant price movements, aiding in making informed trading decisions. The customizable settings of the indicator allow traders to tailor parameters to suit their specific trading strategies and preferences, enhancing its utility in real-world applications.
Real-world traders often rely on TRIX crossovers, divergences, and signals from the zero line to execute trading decisions with precision and confidence. This practical application of the TRIX indicator demonstrates its value in helping traders navigate dynamic market conditions and capitalize on momentum shifts effectively.
What Makes Trix Indicator Momentum Trading Different from Regular Trix Indicator Trading?
Trix indicator momentum trading differs from regular Trix indicator trading in its focus on identifying shifts in momentum rather than just price direction. This approach provides traders with top Trix indicator insights into the strength and sustainability of market trends, allowing for more precise entry and exit points.
Frequently Asked Questions
What Is the Best Setting for the TRIX Indicator?
The optimal setting for the TRIX indicator is commonly a 14-period triple-smoothed EMA. This configuration, offering a balance between sensitivity and noise reduction, is widely favored by traders for its accuracy in momentum analysis across various timeframes.
What Is the Most Accurate Momentum Indicator?
The most accurate momentum indicator is subjective to trading preferences and market conditions. However, the TRIX indicator stands out for its ability to filter noise, detect early trend changes, and provide reliable buy/sell signals based on crossovers above/below the zero line.
Is Trix a Good Indicator?
TRIX, a momentum indicator, is valuable for traders seeking to gauge market dynamics. By smoothing price data with triple exponential moving averages, TRIX aids in identifying overbought and oversold conditions. Combining TRIX with other indicators can enhance trading strategies.
How Do You Read a TRIX Indicator?
To read a TRIX indicator, observe its values relative to the zero line. Positive values signal an uptrend, negatives a downtrend, and near-zero values neutrality. Extreme values may indicate overbought or oversold conditions, guiding market decisions.
Conclusion
In conclusion, mastering the Trix indicator can significantly enhance a trader's ability to analyze market momentum and make informed trading decisions.
By leveraging the insights gained from interpreting Trix signals, optimizing indicator settings, and combining it with other technical tools, traders can gain a competitive edge in the dynamic financial markets.
The Trix indicator's potential for improving trading performance is truly unparalleled, making it a valuable asset for any serious trader.