
You may be hesitant to explore Fibonacci retracement due to its perceived complexity, but understanding this tool can significantly enhance your trading decisions. As you embark on this journey, unraveling the intricacies of Fibonacci retracement can unveil a world of possibilities in predicting market movements.
From identifying key levels to developing strategic entry and exit points, mastering Fibonacci retracement could be the missing piece in your trading toolkit. Get ready to elevate your trading game and unlock the potential of this powerful technique in shaping your trading success.
Understanding Fibonacci Retracement Levels
Indispensable for technical analysis, Fibonacci retracement levels provide traders with crucial insights into potential market reversals based on key percentages like 23.6%, 38.2%, 50%, 61.8%, and 78.6%.

These levels act as a guide for traders to identify potential support and resistance levels in trading. By drawing Fibonacci retracement levels between significant price points on a chart, traders can anticipate where the price may find support or face resistance.
Understanding these levels is essential for traders as they offer a structured approach to analyzing price movements. Incorporating Fibonacci retracement levels into technical analysis can help traders make informed decisions on entry and exit points, thereby enhancing their overall trading strategy.
Fibonacci Sequence and Golden Ratio
The Fibonacci sequence, integral to technical analysis, introduces traders to a series of numbers derived from the sum of the two preceding numbers, with an essential ratio known as the Golden Ratio at approximately 1.618.
- Fibonacci numbers help traders spot potential trend reversals, resistance areas, or support areas in the market.
- The Fibonacci sequence forms the basis for calculating Fibonacci retracement levels used in technical analysis.
- Short-term targets for traders can be set using Fibonacci ratios like 38.2% and 61.8% derived from the sequence.
Understanding these concepts can assist in identifying support and resistance levels, predicting potential reversals, and setting price targets using tools like the Fibonacci retracement tool.
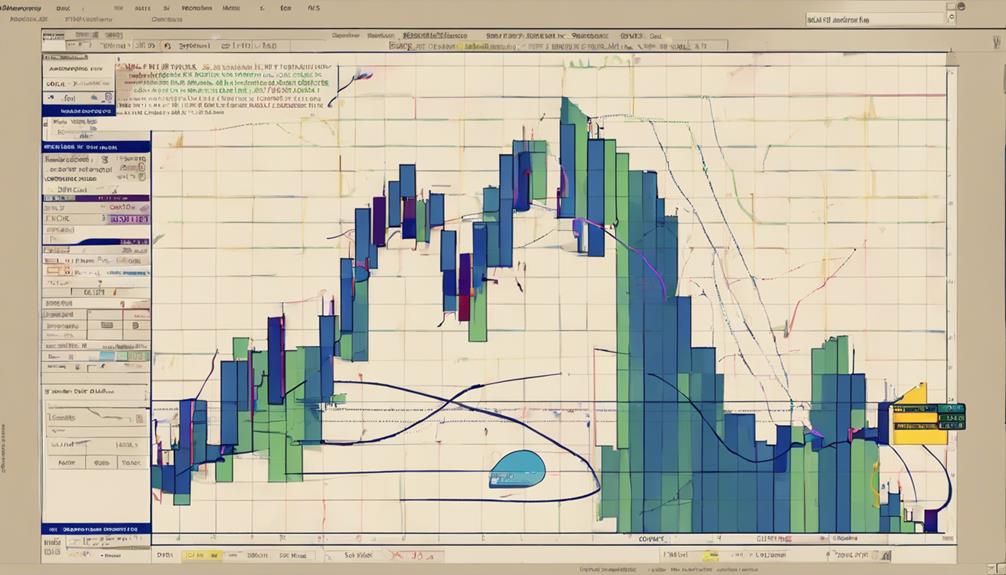
Calculating Fibonacci Retracement Lines
To calculate Fibonacci retracement lines, apply key Fibonacci ratios like 38.2% and 61.8% by subtracting the recent high from the recent low in a price move. Charting software often automates this process, making it easy for traders to plot these levels on their charts.
These levels are considered self-fulfilling prophecies because of their widespread popularity among traders. Fibonacci retracement lines are crucial in price analysis as they help determine potential reversal points in the market, measuring moves from peak-to-trough or trough-to-peak.
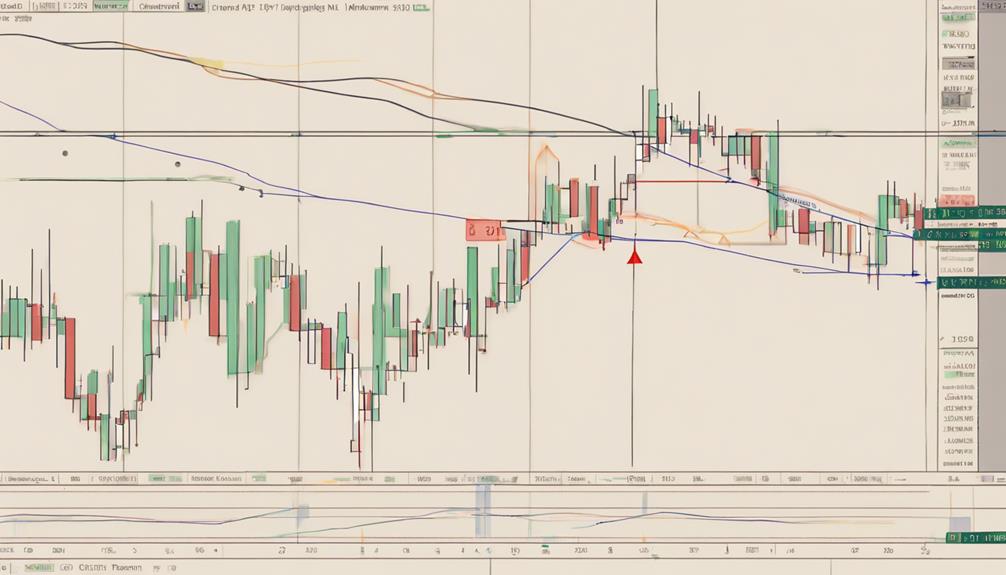
Trading Strategies With Fibonacci Retracements
Utilizing Fibonacci retracement levels strategically can enhance trading decisions and improve risk management strategies. When incorporating Fibonacci analysis into your trading strategies, consider the following key points:
- Identify Key Reversal Levels: Pay close attention to the 38.2%, 50%, and 61.8% Fibonacci levels as potential reversal points, with 23.6% also holding significance in some cases.
- Look for Confirmation Signals: Combine Fibonacci retracement levels with other technical indicators like momentum oscillators to confirm potential price reversals and avoid false signals.
- Manage Risk Effectively: Be cautious of failed reversals, particularly at the 38.2% and 50% Fibonacci levels, and use proper risk management techniques to protect your trading capital.
Trading the Golden Pocket Fibonacci Level
Incorporate the Golden Pocket Fibonacci level into your trading strategy to pinpoint crucial turning points in the asset's price movements effectively. This key level typically ranges between 0.618 and 0.65 and signifies a significant shift in the asset's price direction.
Wait for confirmation signals, such as candlestick patterns or technical indicators, before entering a trade based on the Golden Pocket. Implementing stop-loss orders is crucial for managing risks when utilizing this Fibonacci level.
Establish profit targets based on Fibonacci retracement levels or other technical price levels to optimize your trading strategy. By integrating the Golden Pocket into your trading strategies, you can enhance your ability to identify potential turning points and make informed decisions in the market.
What are the Basic Principles of Fibonacci Retracement?
The basic principles of Fibonacci retracement involve using key levels based on the Fibonacci sequence to identify potential support and resistance levels in a financial market. Traders can use these levels to make strategic decisions when analyzing price charts and implementing advanced Fibonacci retracement techniques.
Frequently Asked Questions
How Do You Use Fibonacci Retracement for Beginners?
To use Fibonacci retracement for beginners, identify key price points, draw Fibonacci levels, and anticipate potential reversals at 23.6%, 38.2%, 50%, 61.8%, and 78.6%. This tool aids in setting price targets and managing risk effectively.
Where Do I Start Fib Retracement?
Start Fibonacci retracement by identifying recent high and low points. Draw levels on the trading platform using key ratios like 38.2%, 50%, and 61.8%. Analyze price reactions at these levels to make informed trading decisions.
What Is the Most Effective Fibonacci Retracement Level?
The most effective Fibonacci retracement level is often the 61.8% level, known as the 'golden ratio.' Traders commonly spot reversals or turning points here. Derived from the Fibonacci sequence, this level frequently influences price movements.
What Is the Best Time Frame for Fibonacci Retracement?
For the best time frame in Fibonacci retracement, consider your trading style and goals. Long-term investors often favor daily charts, while short-term traders may find hourly or 4-hour charts more suitable. Base your choice on your needs.
Conclusion
Now that you have a solid grasp on Fibonacci retracement, you may still be questioning its effectiveness. However, by incorporating Fibonacci levels into your trading strategy and utilizing the Golden Pocket zone, you can increase your chances of making informed trading decisions.
Remember, like any tool, Fibonacci retracement is most effective when used in conjunction with other technical indicators and analysis methods. Keep practicing and refining your skills to master this valuable tool in your trading arsenal.
