
When it comes to spotting bullish candlestick patterns, recognizing these formations accurately can significantly enhance your trading success. Understanding the nuances of these patterns is crucial for traders seeking opportunities in the market.
By mastering the art of identifying bullish candlestick patterns, you can gain a competitive edge and potentially boost your trading performance. Want to uncover how these patterns can potentially elevate your trading game?
Bullish Candlestick Pattern Basics
Bullish candlestick patterns, crucial indicators of potential market reversals, signal buying opportunities following downtrends. These patterns, derived from Japanese candlestick patterns, provide insights into market sentiment and potential price movements.
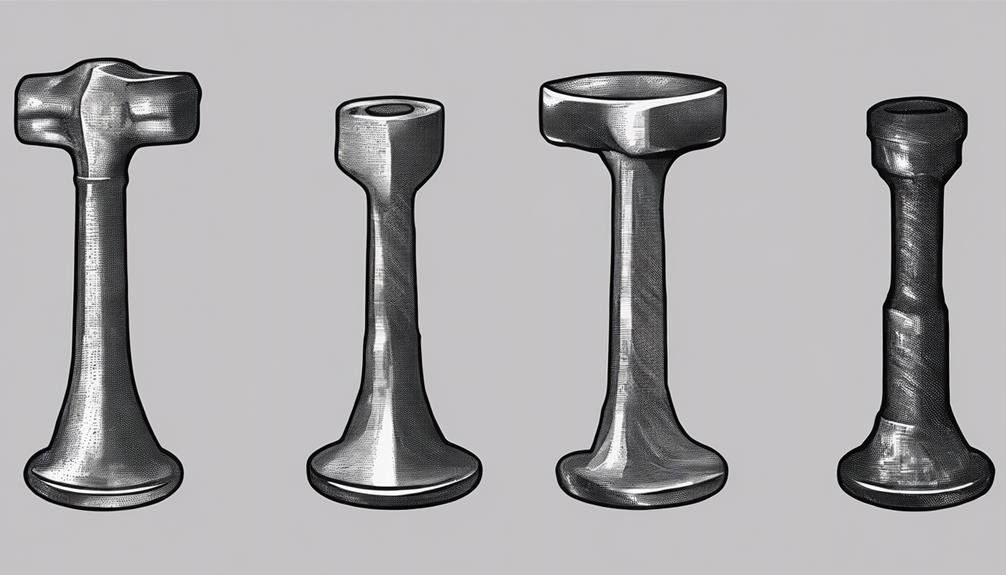
When identifying bullish patterns, such as the Bullish Engulfing, Hammer, or Morning Star, traders look for shifts in momentum from bearish to bullish. Observing these patterns after a downtrend suggests a possible trend reversal, offering traders a chance to enter the market at favorable prices.
Confirmation of these patterns through volume analysis and additional technical indicators is crucial for making informed trading decisions. Understanding the significance of support and resistance levels further enhances the ability to recognize and act upon bullish candlestick patterns effectively in the market.
Common Bullish Reversal Patterns
When analyzing market trends, recognizing common reversal patterns is essential for traders seeking profitable opportunities.
Common bullish reversal patterns such as the bullish engulfing, hammer, morning star, piercing, and bullish harami patterns indicate a potential shift from a downtrend to an uptrend. It's crucial to wait for confirmation of these patterns before making trading decisions.
These patterns offer valuable insights into potential price reversals, aiding traders in understanding the implications for their strategies. By comprehending the characteristics of these bullish reversal patterns, traders can make well-informed decisions and position themselves strategically in the market for potential gains.
Understanding the significance of these patterns is key to successful trading in identifying potential price reversals.
Bullish Continuation Patterns
Continuation patterns in trading signify a temporary pause in the current uptrend before its likely resumption. Bullish Flag, Bullish Pennant, and Ascending Triangle are examples of bullish continuation patterns that indicate a high probability of the existing uptrend continuing.
Traders anticipate and capitalize on ongoing upward price movements by looking for volume confirmation and breakout signals to validate these patterns. The Bullish Flag is characterized by a rectangular pattern, the Bullish Pennant appears as a small symmetrical triangle, and the Ascending Triangle shows a series of higher lows and a relatively constant high.
Understanding these bullish continuation patterns helps traders make informed decisions and strategize effectively in the market.
Other Bullish Candlestick Patterns

After exploring bullish continuation patterns, it's essential to delve into other bullish candlestick patterns that can provide valuable insights for traders in the market.
The Morning Star, Piercing Line, and Three White Soldiers patterns are significant in identifying potential bullish reversals.
The Morning Star pattern, consisting of three candles, signals a trend reversal.
Conversely, the Piercing Line pattern indicates strong buying pressure following a downtrend, while the Three White Soldiers pattern showcases consistent buying pressure in an uptrend.
These patterns, along with the Bullish Engulfing and Hammer patterns, play a vital role in recognizing potential trend reversals in the market, offering traders valuable opportunities to capitalize on bullish movements.
Trading Strategies With Bullish Patterns
To enhance your trading proficiency, implementing strategic approaches with bullish patterns can amplify your success in navigating the market dynamics. Bullish candlestick patterns like the Hammer and Morning Star are indicative of potential price reversals within an uptrend. Confirming these patterns with indicators such as moving averages can significantly increase trading success rates.
Incorporating volume analysis alongside bullish patterns aids in validating the strength of buying pressure. Traders often seek out bullish patterns near key support levels to bolster the probability of successful trades. Particularly robust are bullish engulfing patterns following extended downtrends, as they suggest possible trend shifts.
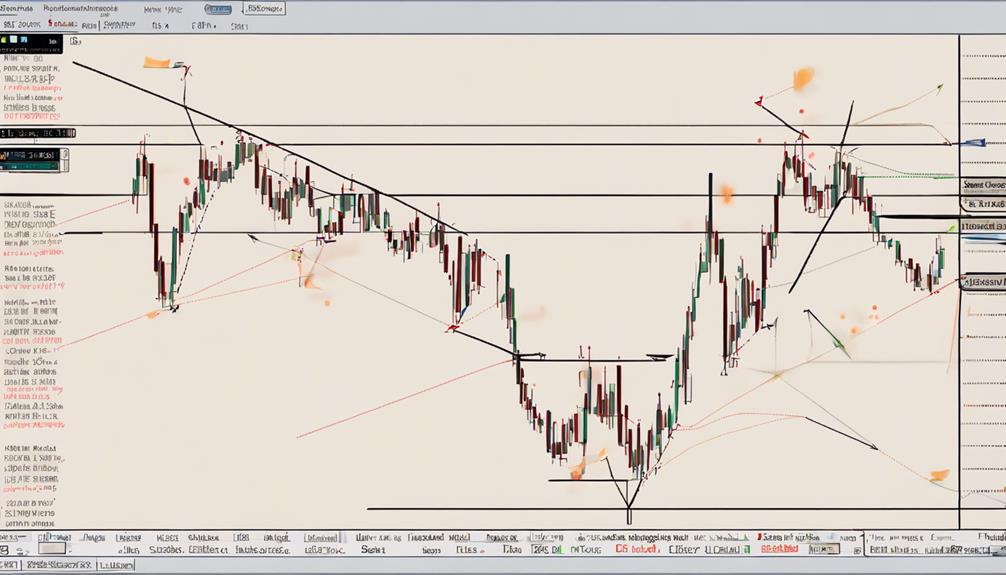
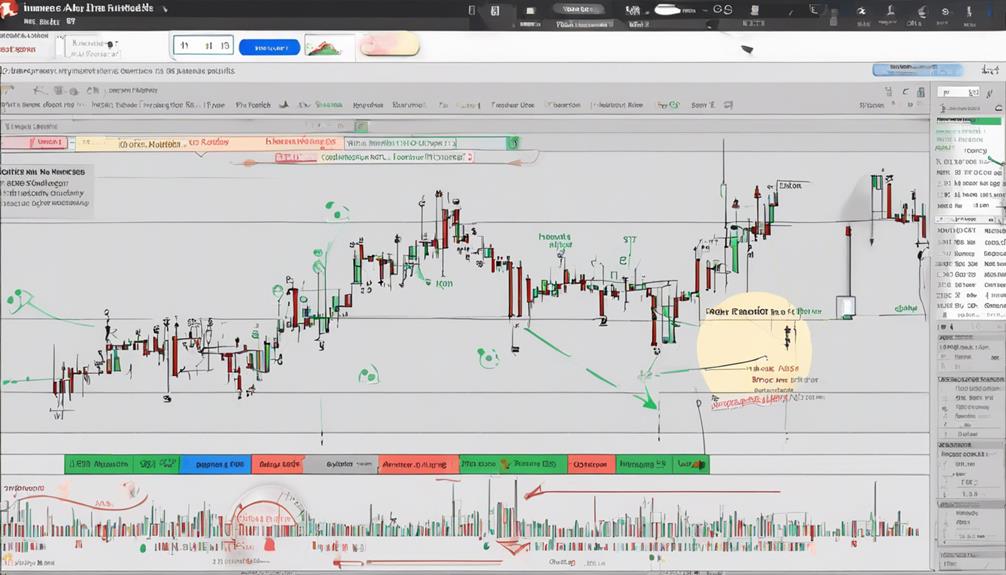
How Can I Spot Bullish Candlestick Patterns in Technical Analysis Software?
When using technical analysis software, look for specific candlestick patterns in analysis that indicate a bullish trend. These patterns include the hammer, engulfing pattern, and morning star. By identifying these formations, traders can make informed decisions about when to enter or exit a trade.
Frequently Asked Questions
What Is the Best Bullish Candlestick Pattern?
The best bullish candlestick pattern for you depends on your strategy and risk tolerance. Look for patterns like Bullish Engulfing, Hammer, Morning Star, or Piercing Line. Confirm signals and watch for volume increases to validate patterns effectively.
What Is the Most Successful Candlestick Pattern?
The most successful candlestick pattern is the Bullish Engulfing. It involves a large bullish candlestick overtaking a smaller bearish one, signaling a strong shift from bearish to bullish momentum. Traders often seek confirmation before acting on this pattern.
How Many Bullish Candlestick Patterns Are There?
You've asked about the number of bullish candlestick patterns. There are several, like bullish engulfing, hammer, morning star, piercing, and bullish harami. Each pattern signifies potential market shifts, offering traders valuable insights for decision-making.
What Is the AI Tool for Candlestick Patterns?
The AI tool for candlestick patterns utilizes machine learning algorithms to analyze price data. It identifies bullish candlestick patterns like engulfing, hammer, morning star, and more. Traders can customize it for specific timeframes or assets.
Conclusion
In conclusion, mastering the art of identifying and interpreting bullish candlestick patterns is essential for successful trading. By recognizing patterns like the Hammer and Bullish Engulfing, traders can anticipate potential market reversals and capitalize on profitable opportunities.
Remember, the market is dynamic, and staying ahead of the curve requires a keen eye for patterns and trends. So, keep honing your skills and stay vigilant for the next bullish signal to maximize your trading potential.