
In the realm of swing trading, honing in on the most effective candlestick patterns is essential for making well-informed decisions.
You may have heard of popular patterns like the hammer, engulfing, or piercing candlestick patterns, but have you ever considered how these patterns can significantly impact your trading strategy?
Understanding the nuances of these candlestick formations could be the key to unlocking a whole new level of success in your swing trading endeavors.
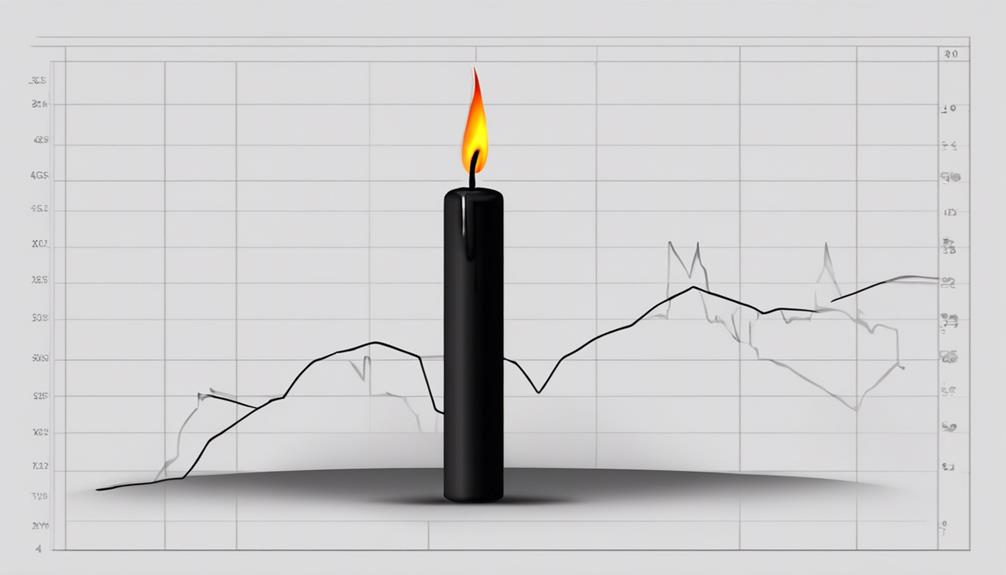
Hammer Candlestick Pattern
The Hammer candlestick pattern signals a potential bullish reversal at the conclusion of a downtrend. This candlestick formation in swing trading is characterized by a small body at the top with a long lower shadow, resembling a hammer.
Traders interpret this pattern as a bullish reversal signal indicating a shift in market sentiment from bearish to potentially bullish. The appearance of a Hammer pattern suggests a buying opportunity as it hints at a possible trend reversal. Traders often wait for confirmation through higher prices in the subsequent trading period.
Understanding the dynamics of the Hammer pattern is essential for swing traders looking to capitalize on potential market reversals and identify entry points for profitable trades.
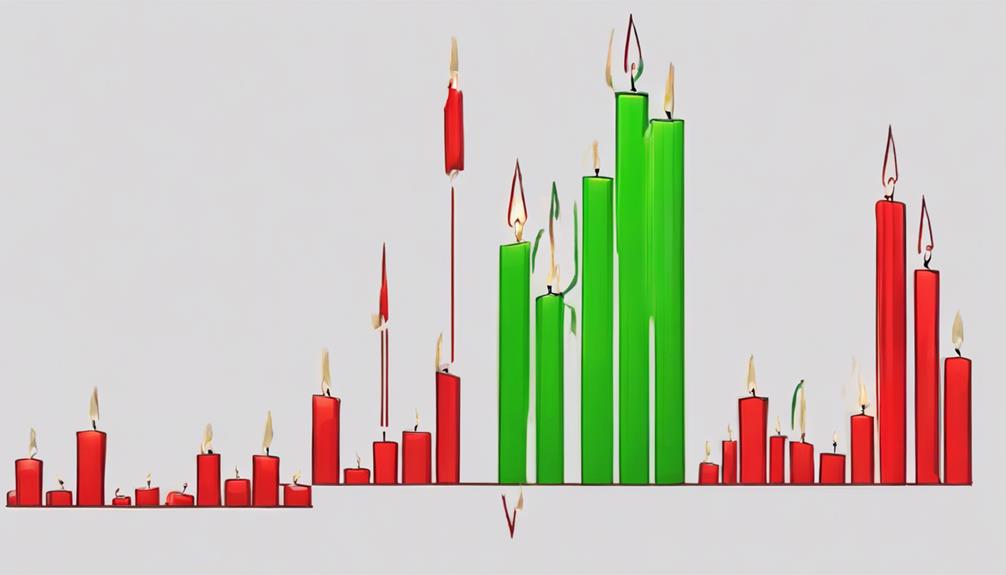
Engulfing Candlestick Pattern
When identifying potential trend reversals in swing trading, pay close attention to the Engulfing Candlestick Pattern as it offers clear visual signals of market sentiment shifts. The pattern consists of two candles where the second one completely engulfs the prior, indicating a potential trend reversal.
The bullish engulfing pattern forms at the end of a downtrend, signaling a shift from selling pressure to buying pressure. Conversely, the bearish engulfing pattern forms at the end of an uptrend, indicating a shift from buying pressure to selling pressure. Swing traders find this pattern valuable for assessing potential changes in market sentiment and direction. It's essential to look for high trading volume to confirm the validity of the engulfing candlestick pattern.
- Bullish engulfing pattern signals buying pressure.
- Bearish engulfing pattern indicates selling pressure.
- Pattern offers visual signals of market sentiment shifts.
- Important for potential trend reversals.
- Traders confirm validity with trading volume.
Piercing Candlestick Pattern
To identify potential bullish reversals in downtrends, consider the Piercing Candlestick Pattern, a two-candle formation signaling a shift in market sentiment towards a bullish outlook. This pattern starts with a bearish candle followed by a bullish candle that closes above the midpoint of the previous candle.
It suggests a potential trend reversal from bearish to bullish, making it valuable for determining entry and exit points in swing trading strategies. Traders often seek confirmation from increased volume or other technical indicators before acting on this pattern.
The Piercing Candlestick Pattern's ability to indicate a change in market sentiment and potential shift in trend direction makes it a significant tool for traders looking to capitalize on bullish opportunities in downtrends.
Harami Candlestick Pattern
Exploring the intricacies of the Harami Candlestick Pattern sheds light on potential trend reversals or continuations in market movements. The pattern, whether bullish or bearish, can offer valuable insights for traders engaging in swing trading strategies. Here are some key points to consider when analyzing the Harami candlestick pattern:
- The Harami pattern consists of two candles, with the second candle smaller and within the range of the previous candle.
- It signals a potential trend reversal or continuation based on preceding price action.
- Traders often wait for confirmation from other technical indicators before making trading decisions using the Harami pattern.
- The bullish harami typically forms in a downtrend, while the bearish harami appears in an uptrend.
- Understanding market conditions and context is essential for effectively utilizing the Harami pattern in swing trading.
Shooting Star Candlestick Pattern

The Shooting Star candlestick pattern serves as a bearish reversal signal observed at the conclusion of an uptrend, indicating a potential shift in market sentiment towards a downward movement. This pattern is characterized by a small body positioned at the top of the price range with a long upper shadow, suggesting increased selling pressure and potential for a market reversal.
Traders often use confirmation from technical indicators such as the Stochastic Oscillator to validate the significance of the Shooting Star pattern. When incorporating the Shooting Star into swing trading strategies, it's crucial to prioritize proper risk management and consider the overall market context to make informed decisions and manage potential downside risks effectively.
Can Candlestick Patterns for Swing Trading Be Applied to Trading Breakouts as Well?
Yes, trading breakouts with candlestick patterns can be applied to trading breakouts as well. Certain candlestick patterns, such as bullish engulfing or piercing line, can signal potential breakouts, providing traders with valuable entry and exit points. Understanding these patterns can improve breakout trading strategy effectiveness.
Frequently Asked Questions
Which Candlestick Pattern Is Most Reliable for Swing Trading?
For swing trading, the most reliable candlestick pattern is the bullish engulfing. It signals potential trend reversals with high accuracy. When identifying entry and exit points, consider incorporating this pattern into your strategy.
What Is the Best Swing Trade Pattern?
When swing trading, look for the Bullish Engulfing Pattern as it signals a strong trend reversal. Bearish Engulfing Patterns also indicate potential reversals. Hammer Patterns and Shooting Star Patterns are essential for spotting trend changes.
What Is the Most Successful Candlestick Pattern?
When swing trading, the most successful candlestick pattern is crucial. Look for signals like bullish engulfing, bearish engulfing, hammer, and shooting star patterns. Recognizing these can guide your trading decisions effectively for trend reversals.
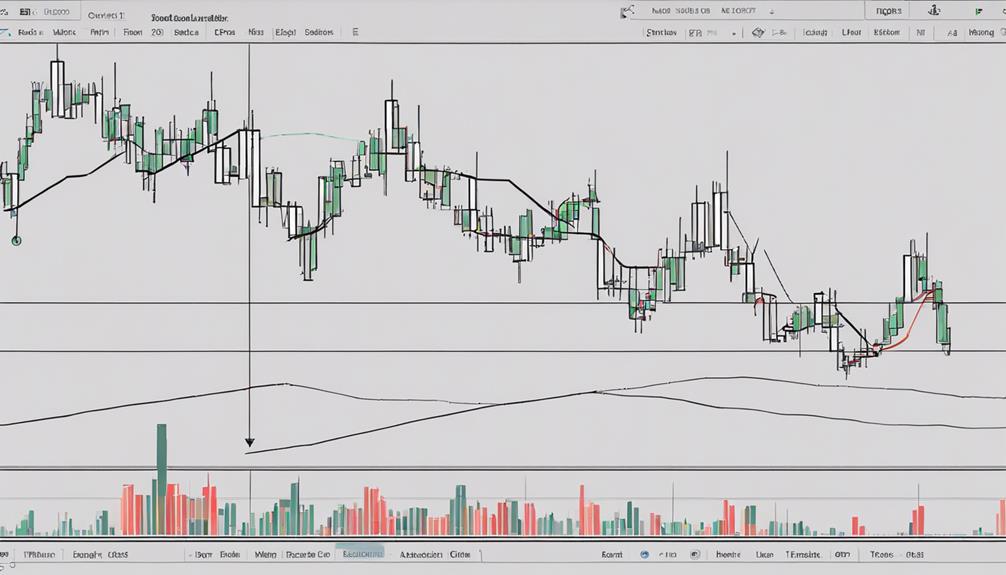
What Is the Best Chart Type for Swing Trading?
You think you know swing trading, but are you using the best chart type? Candlestick charts shine in this arena, illuminating price action and sentiment. Engulfing patterns and hammers reveal trends for strategic entries and exits.
Conclusion
In conclusion, mastering the best candlestick patterns for swing trading is like having a sharp tool in your trading arsenal. By recognizing these patterns and using them to your advantage, you can navigate the market waves with ease and precision.
Remember, knowledge is power in the world of trading, and these candlestick patterns can be your guiding light towards success. So, keep an eye out for these patterns and watch your trading skills soar to new heights.